


For the last client project we had, my task was to build an Infographic (for internal purposes) to let the Business understand where the orders come from by Region.
The best visual way to provide this information is through a map!
The dataset I had contained the detail by postcode and areacode (in the UK) for each order, so I needed to work a bit in Alteryx in order to have a map in Tableau! Below the two workflows I have built.
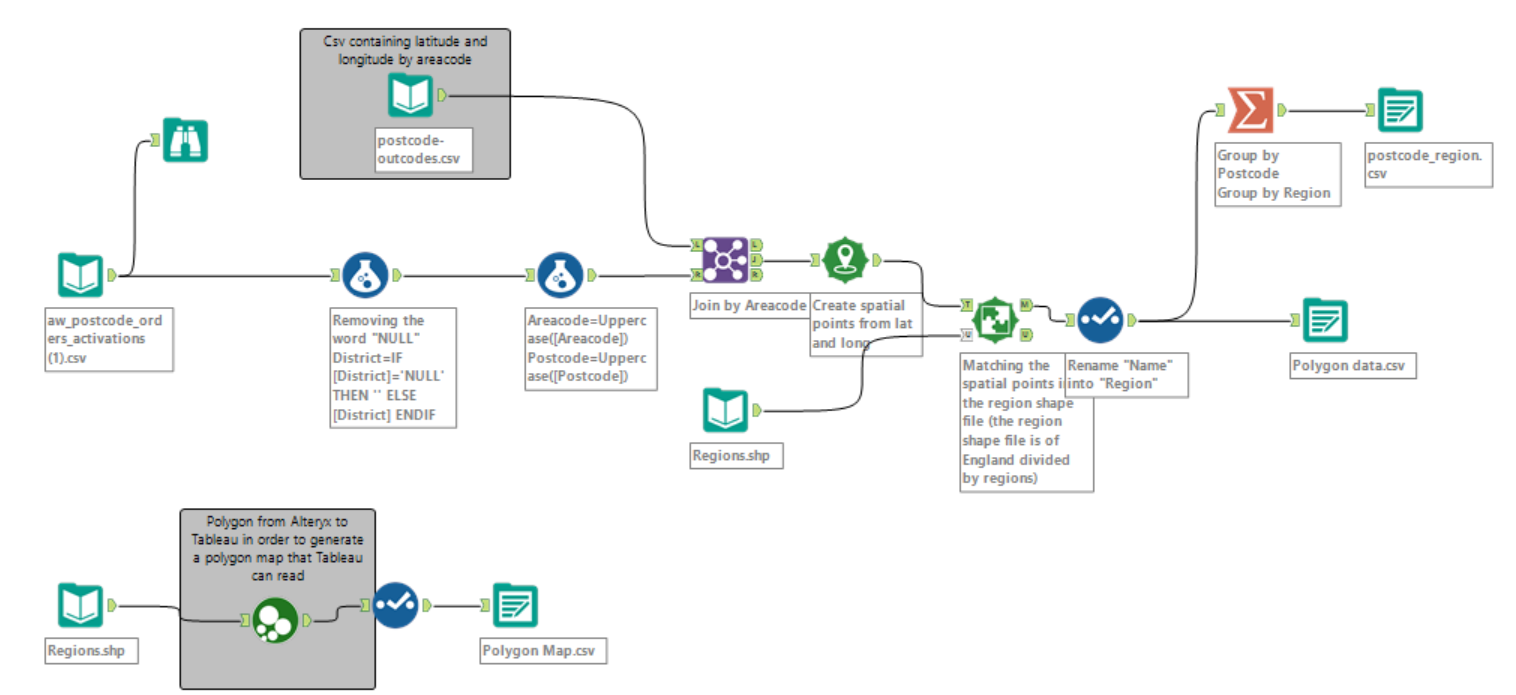
1.WORKFLOW TO ASSIGN LATITUDE&LONGITUDE AND THE REGION TO POSTCODES
STEP 1
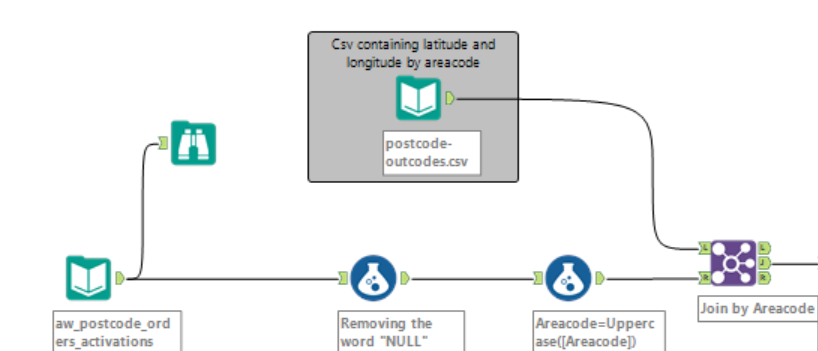
First of all, I need to assign Latitude and Longitude for each postcode: I build an Alteryx Workflow with the dataset and I join it by Areacode with another dataset containing latitude and longitude by postcode.
STEP 2
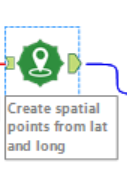
Then, I use the “Create Points” tool in order to transform latitude and longitude into spatial points.
STEP 3
Input a shapefile containing England Regions and use a “Spatial Match” tool in order to match the spatial points created in step 2 into the regions.

You can then create an output to use in Tableau as your dataset! But what about the map?
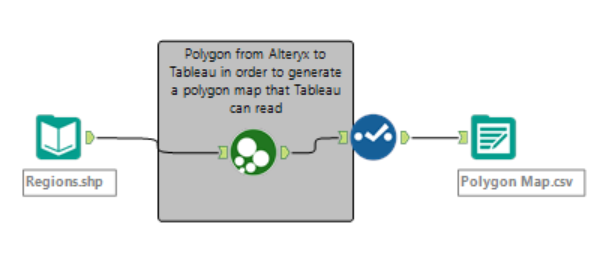
2.WORKFLOW TO GENERATE A MAP FOR TABLEAU
STEP 4
The workflow below is build using a Macro called “Tableau Polygon” that is very useful because it generates a map that Tableau can read!
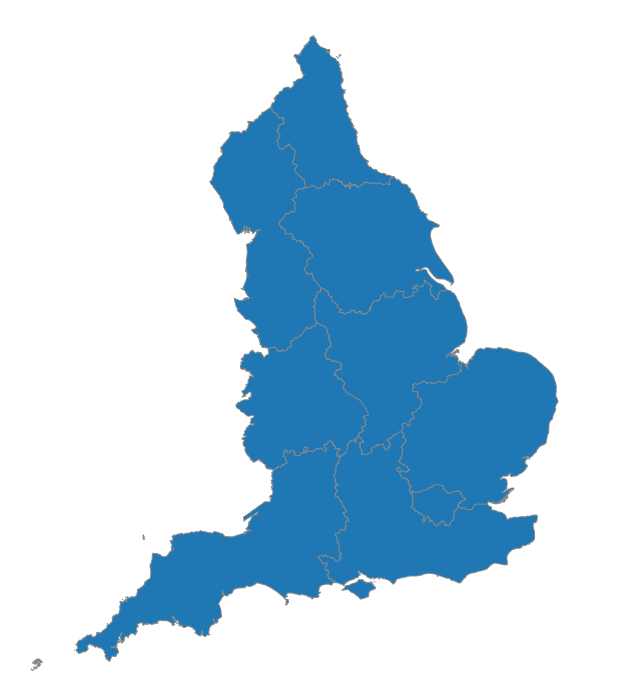
Here is the map!
Now, just blend the two datasets in Tableau by the common field “Region” and build the visualization!
Hope you find it useful.
A presto!
PS:Thanks Ben for helping!