


Benedetta and I met for lunch on a Saturday of December and we put together our thoughts about what we have done during the first weeks in the Data School.
We have discovered that both of us are used to start from the theory to better understand the exercises (Italian University habits?), so we started reading the book “Tableau your data”. I honestly think we have both fallen in love with this book.
The question “when use what?” has helped us in our exploration of the following subjects:
- Context filter (Benedetta will clarify in a post “ad hoc” their use)
- Dual axis
- Groups, Sets and Parameters.
DUAL AXIS
If you are building a graph with two different measures on it, you want to use a dual axis if:
- You want to put these measures in different forms, for example, a line chart for sales and a bar chart for profit
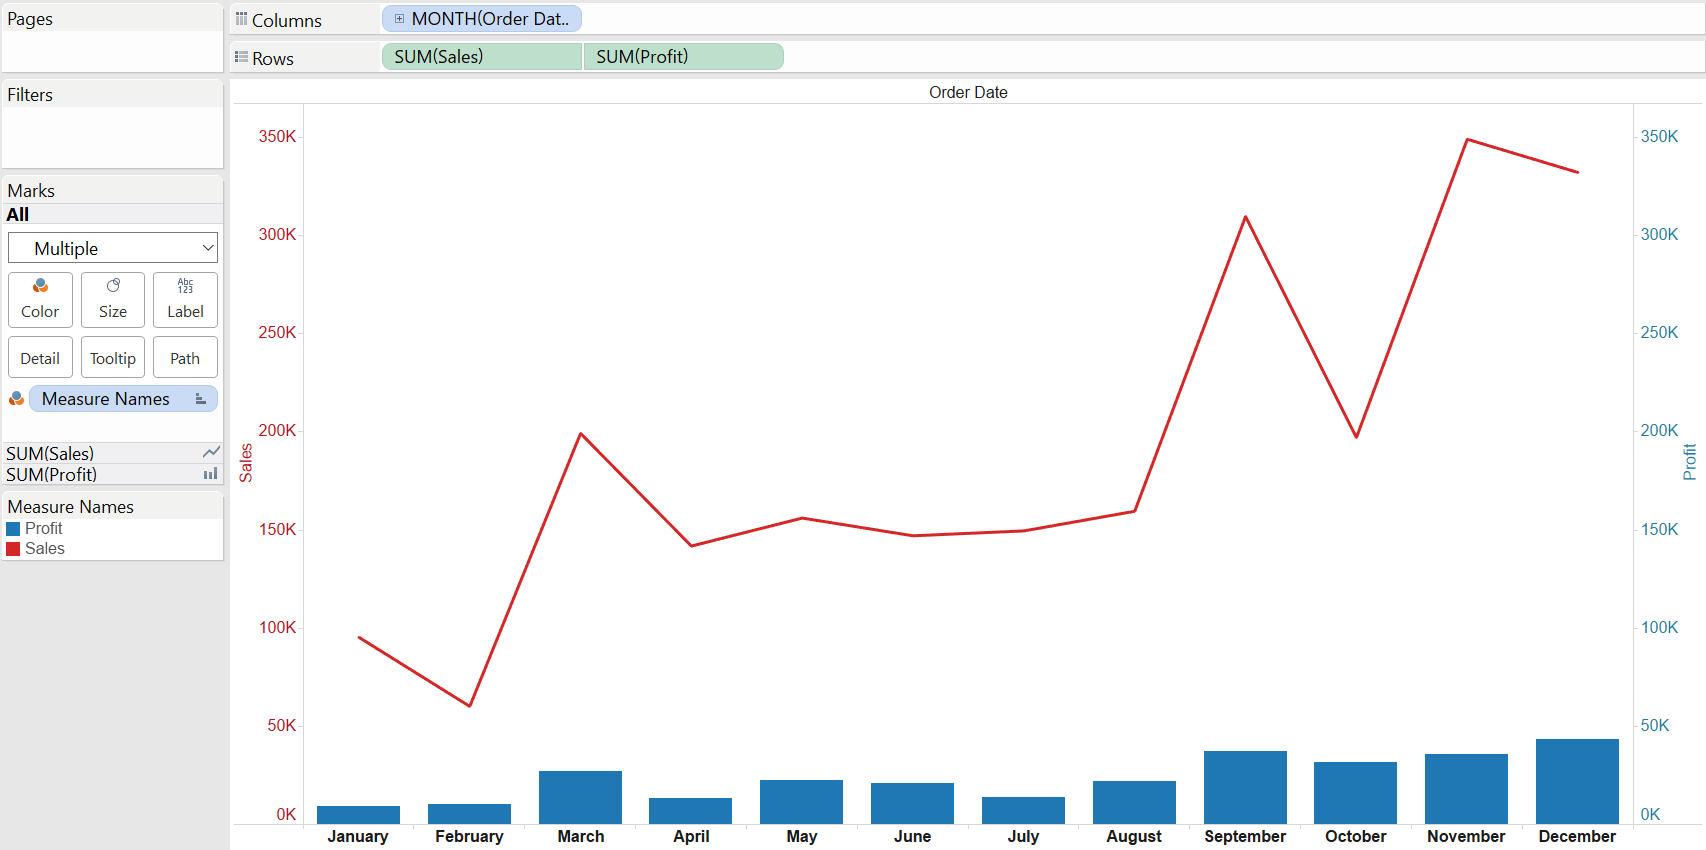
- You do not want to synchronize the value scale of your axis (sales and profit)

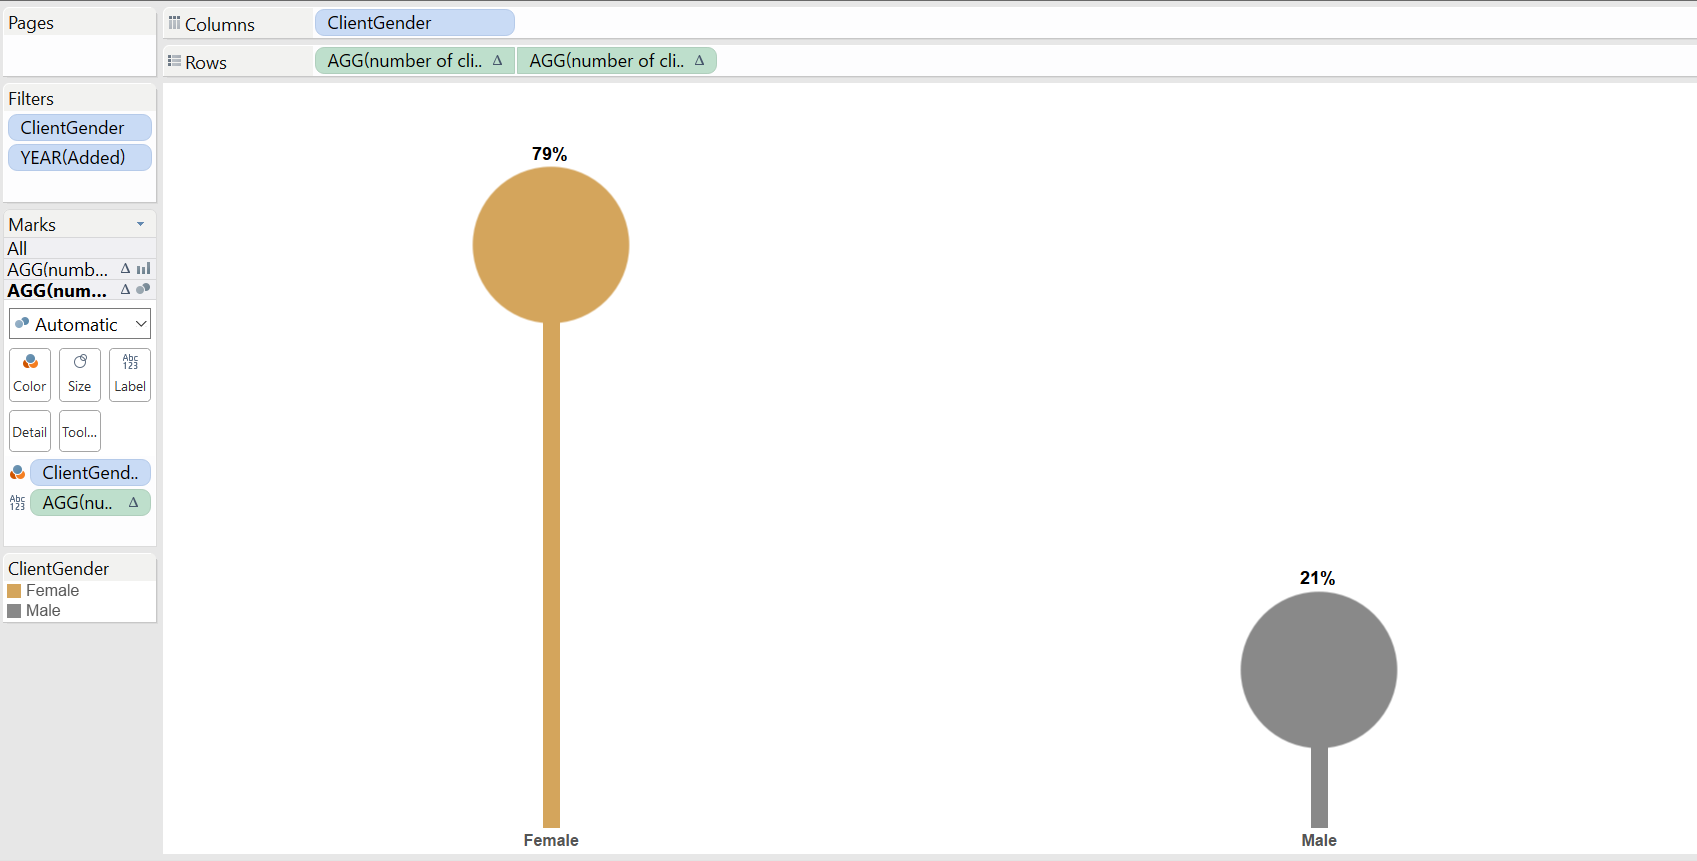
- You want to build creative graphs, such as “lollipop graphs”
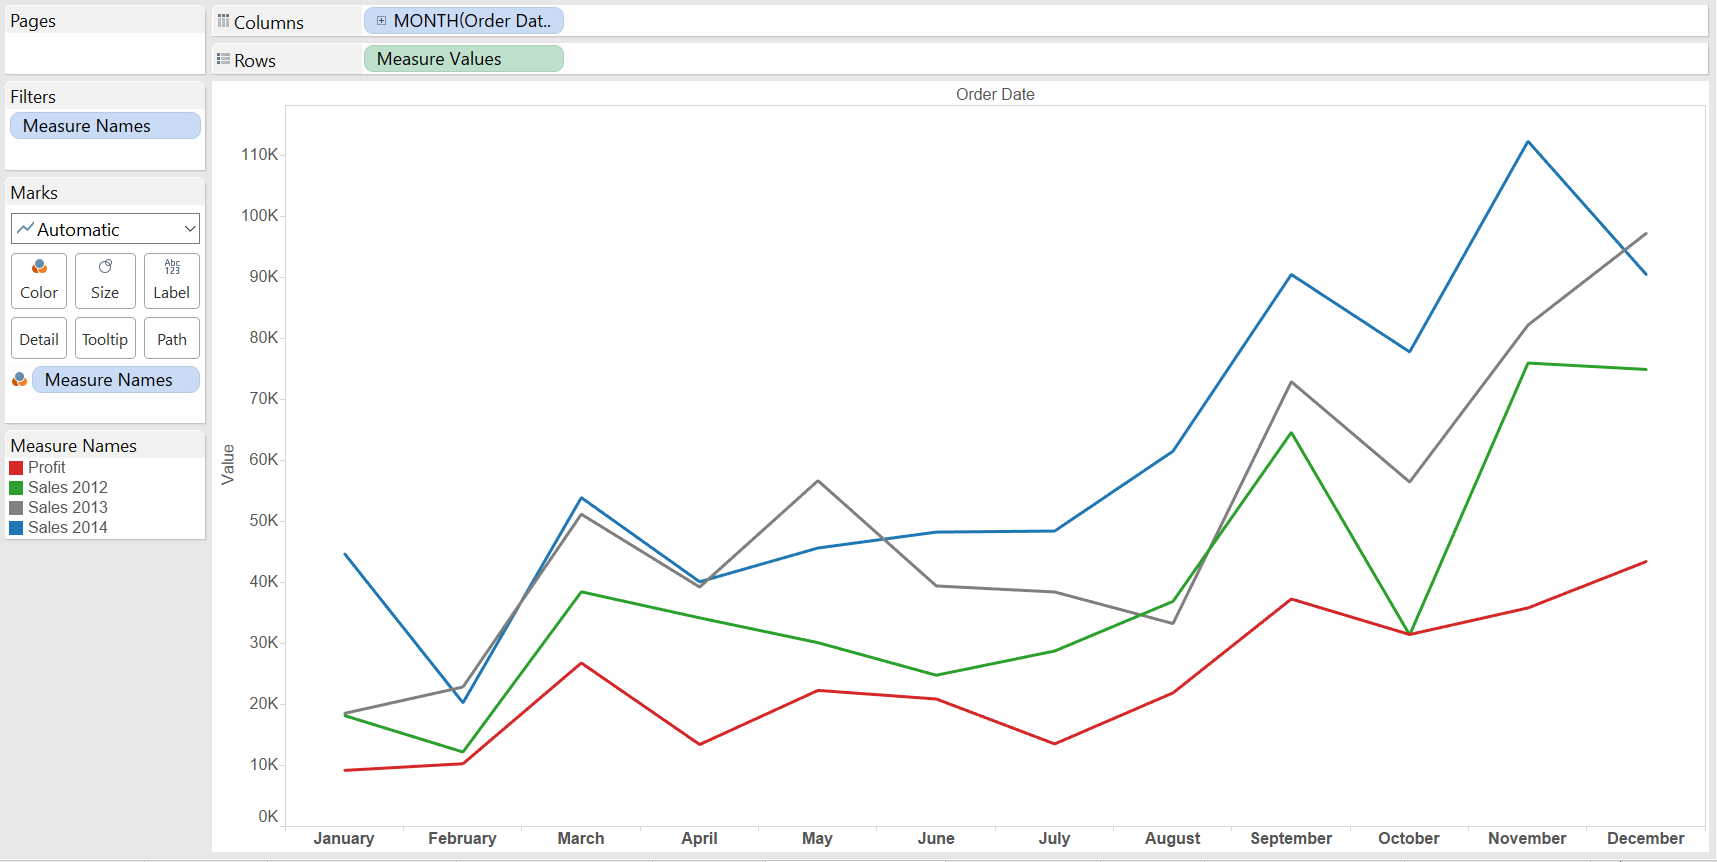
However, if your need is combining two measures or more on the same axis, you will use Shared Axis
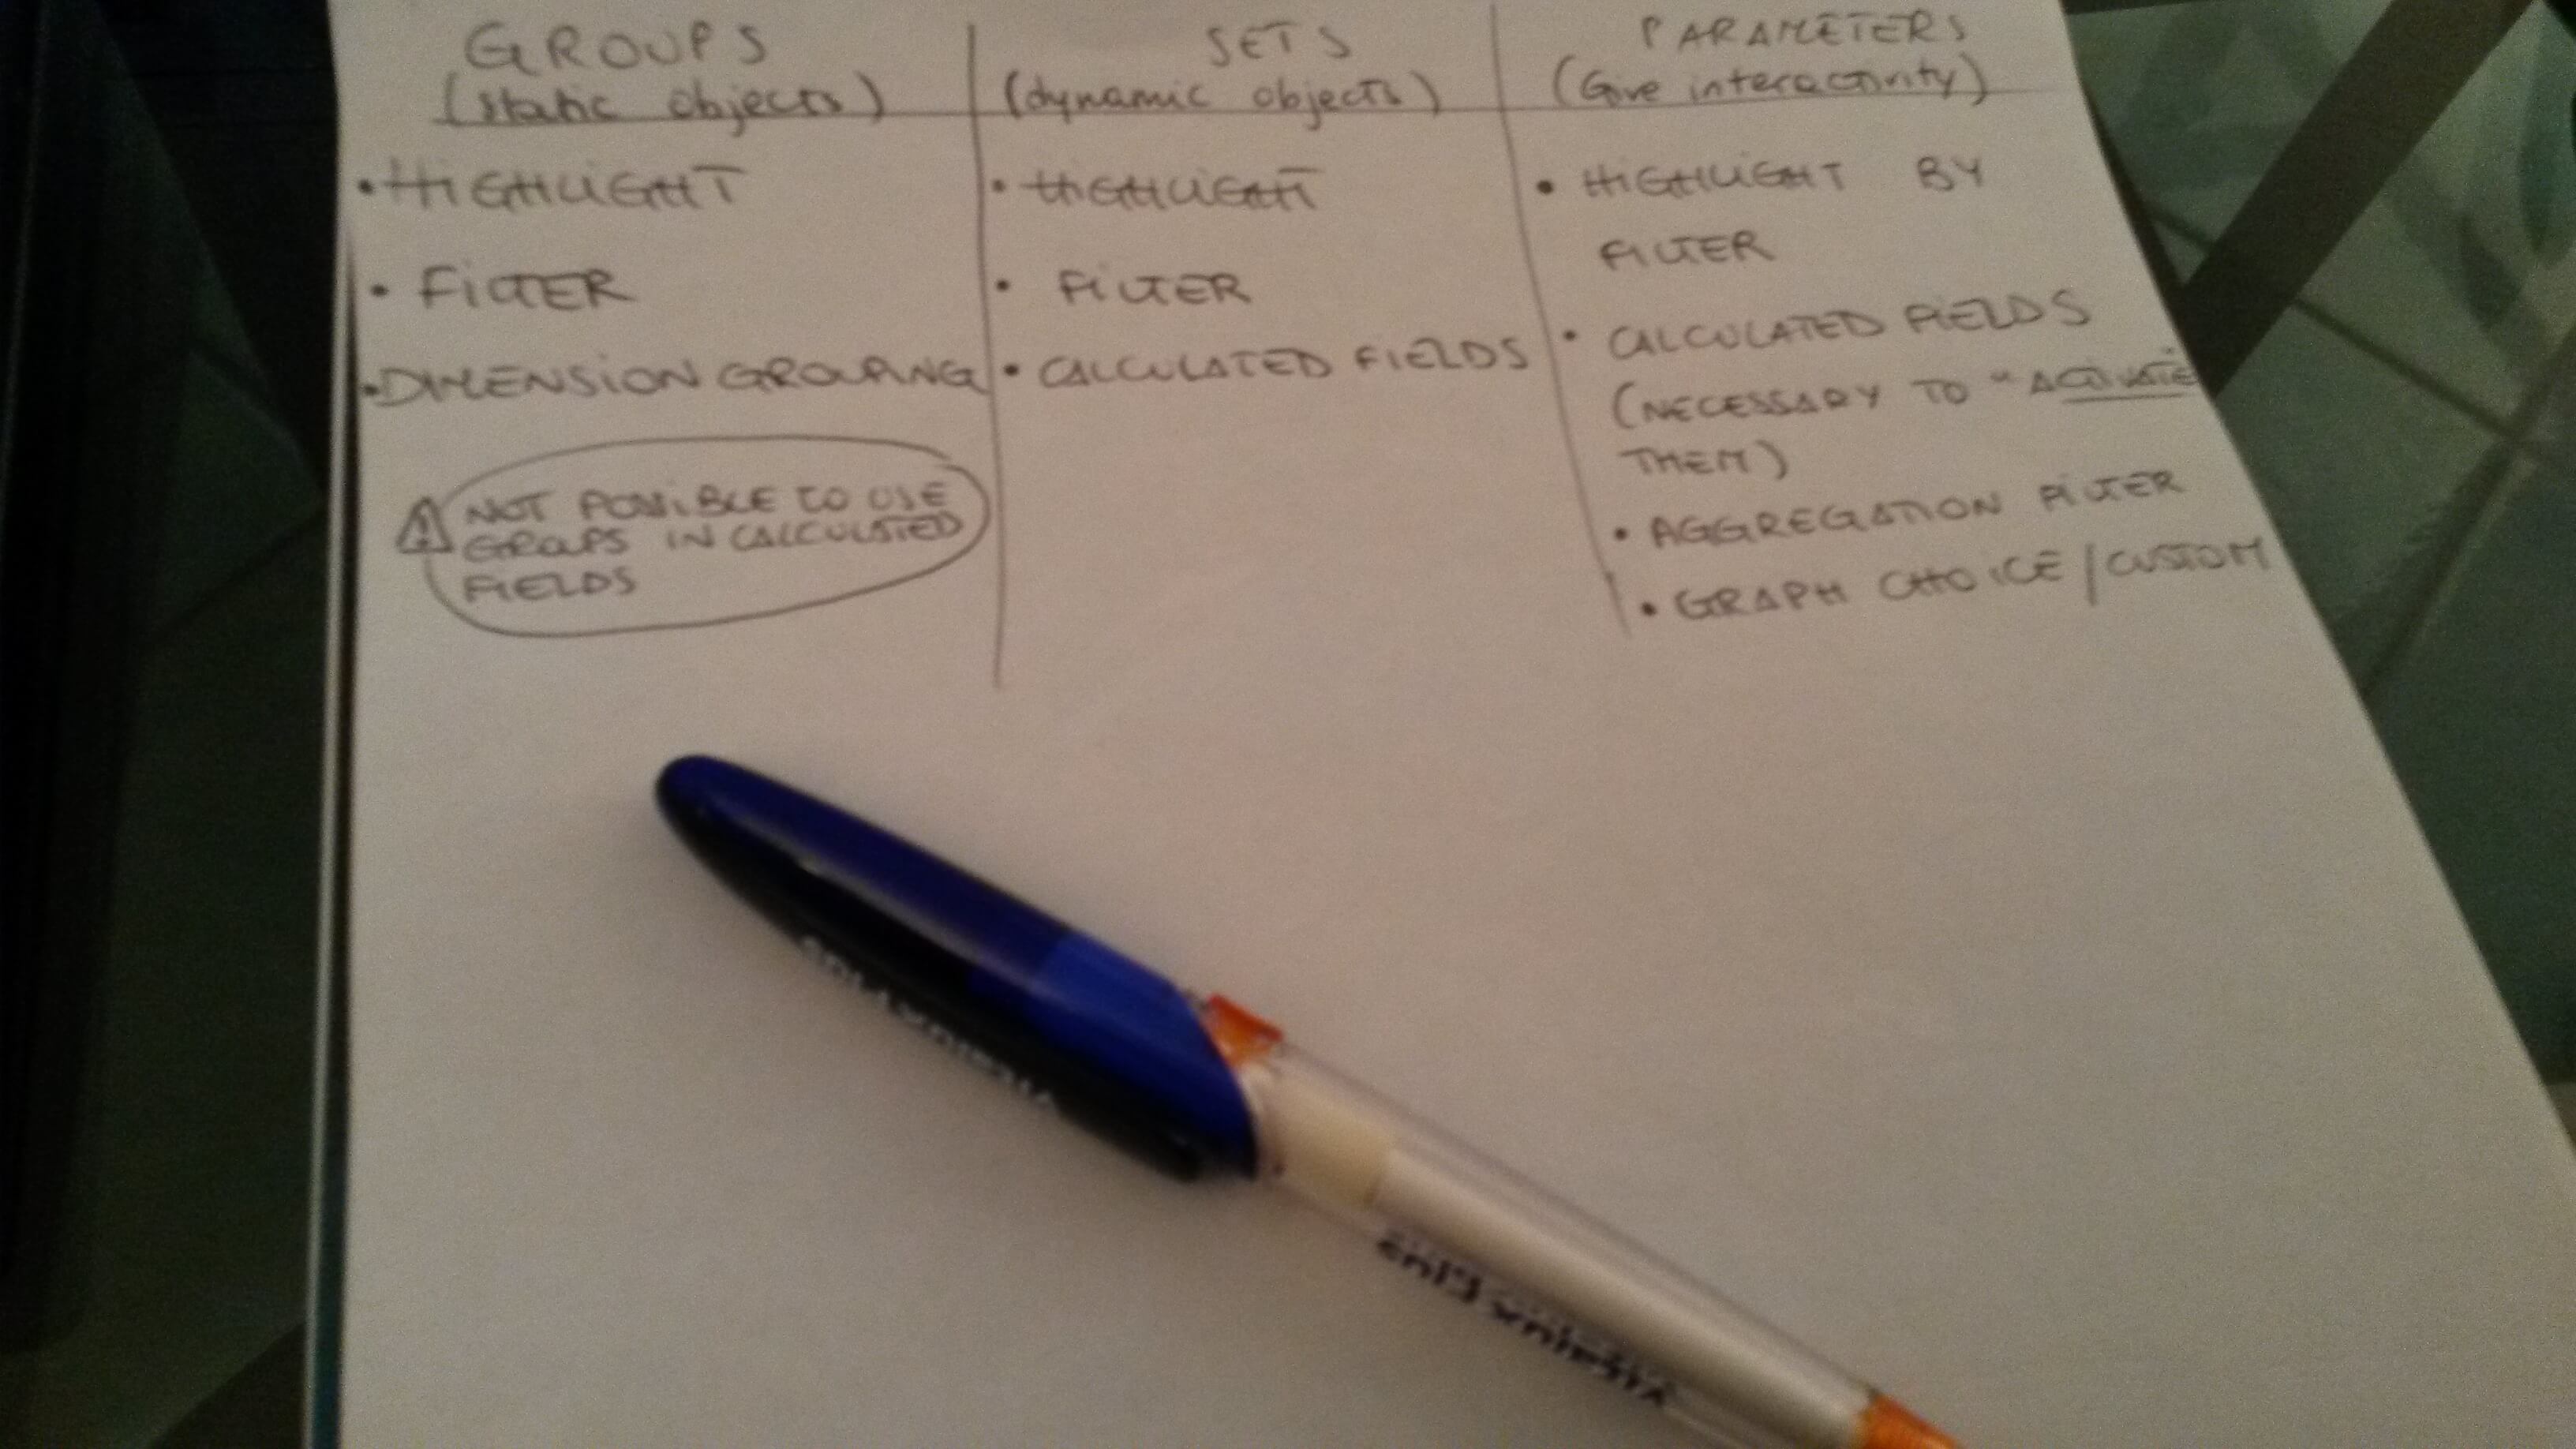
GROUPS, SETS AND PARAMETERS
When Benedetta and I talked about groups, sets and parameters, we thought to build a table with (some of) the cases of their use.
I am pretty sure that the more we will practice, the more we will discover the full potential of these objects (and the more our table will become rich of bullet). 🙂
Hope you enjoyed!
Have a lovely Christmas!