


There are two ways to create a highlight table in Tableau: 1. Utilizing “Show Me” function; 2. Manually. Here are the steps that you need to follow to create a highlight table both ways. In this example I will be using Tableau’s Sample – Superstore dataset.
Highlight table using “Show Me”
Step 1
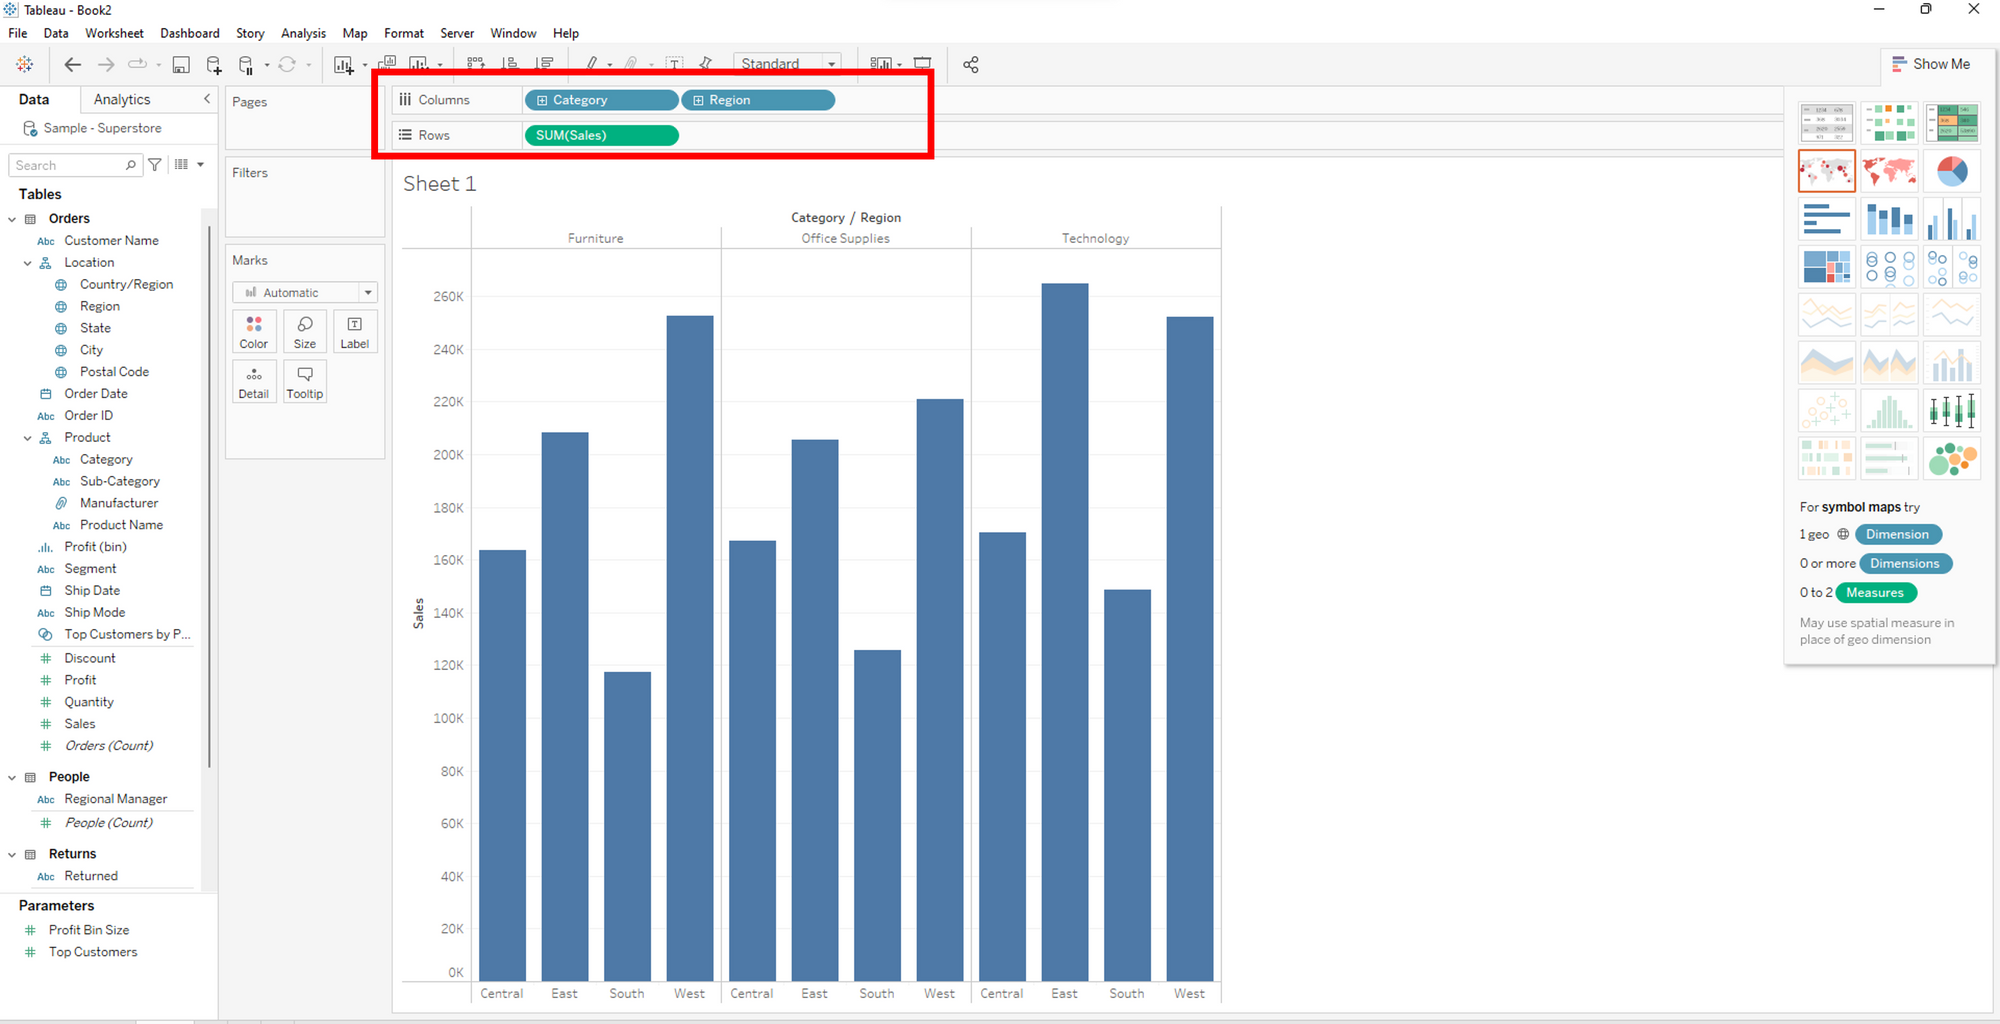
Place 1 measure and 1 or more dimensions in the view.
Step 2
Click on “Show Me” section in the upper left corner of the worksheet and select highlight table.
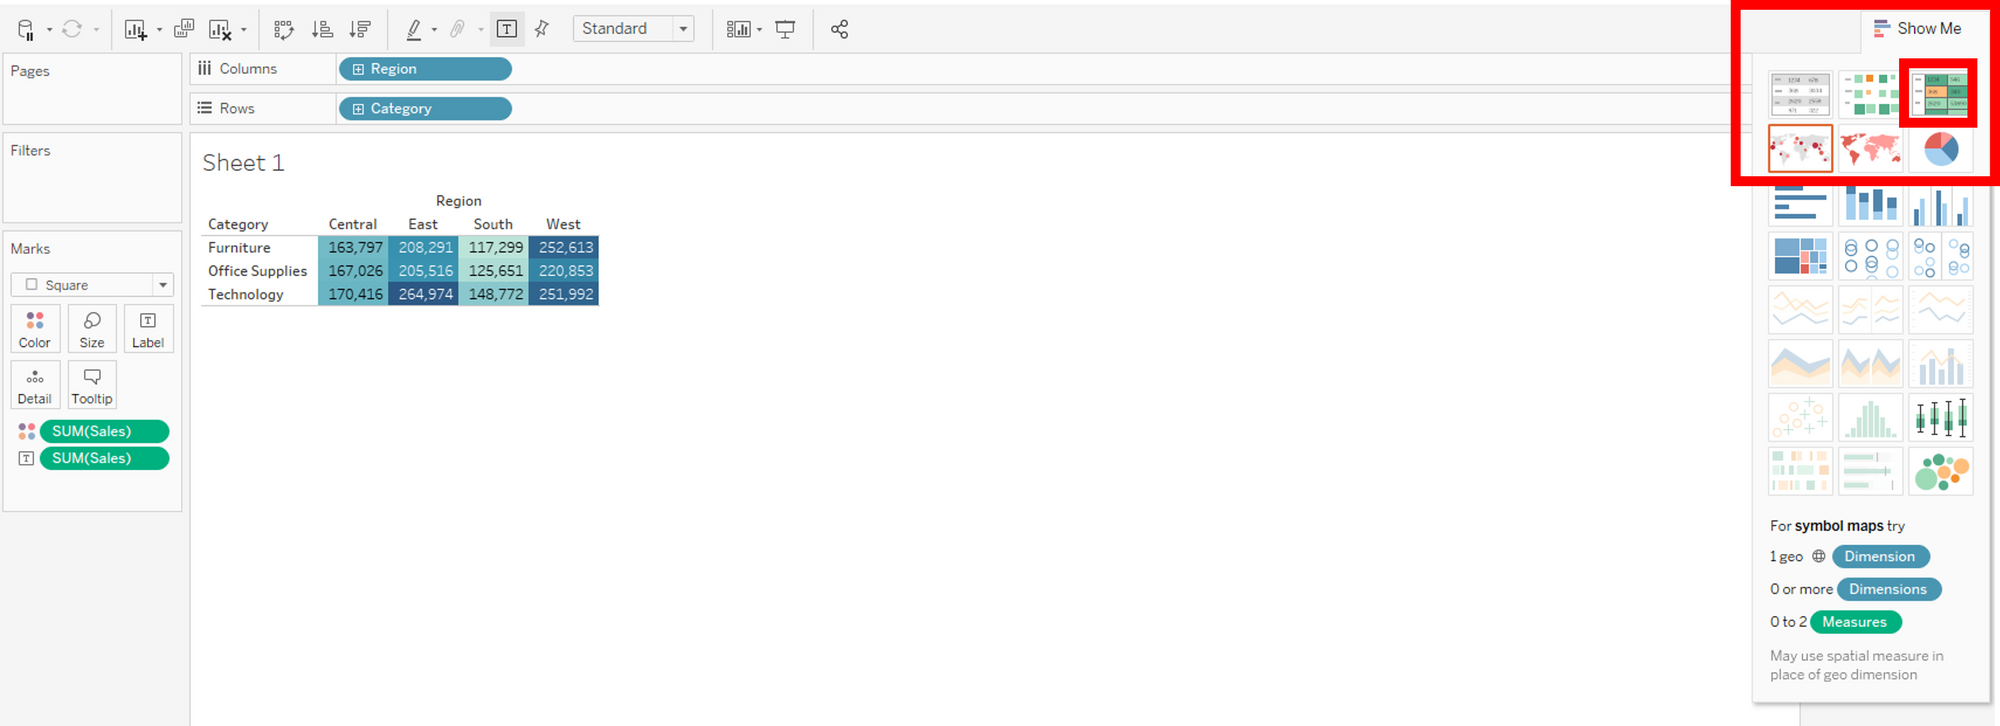
You can then move the dimensions to columns and rows to achieve the view that you are looking for. Here is your highlight table!
Manual highlight table
Step 1
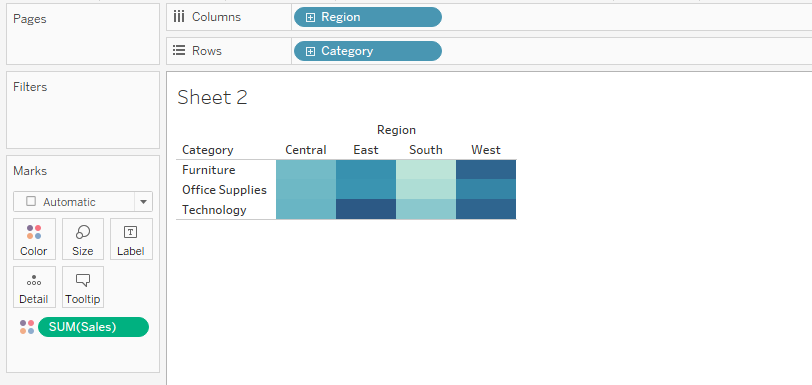
Drag your dimensions to rows and columns. In this case I am using Region on columns and Category on Rows.
Step 2
Drag your measure onto color. Here I am using Sales.
Step 3
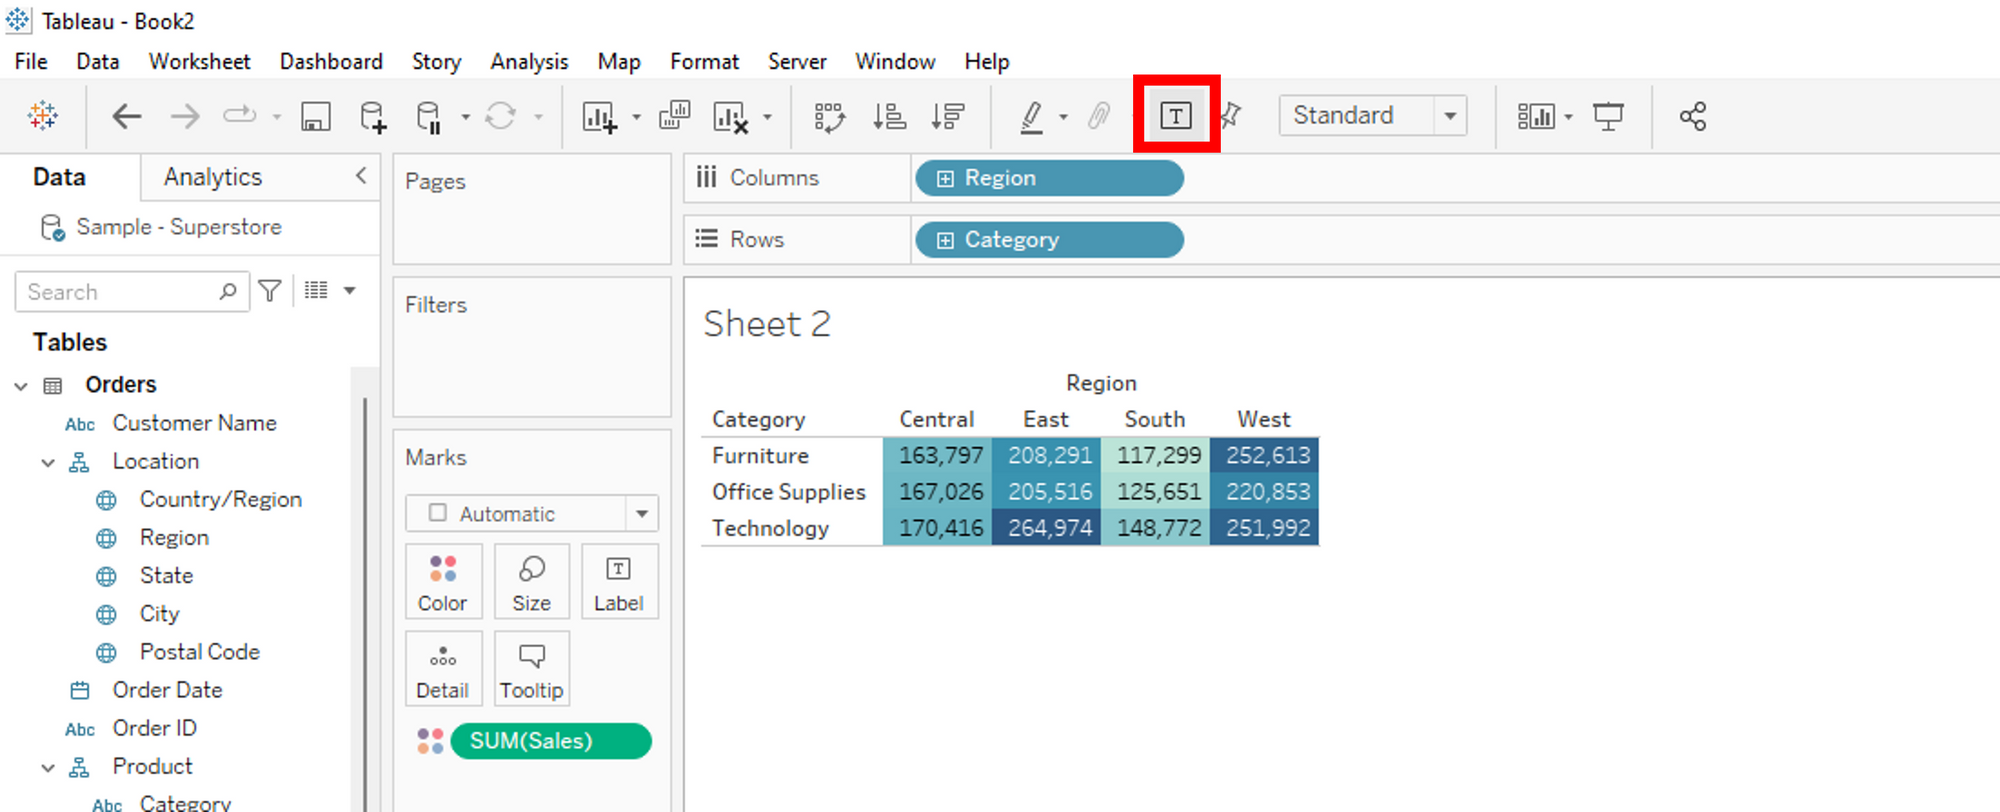
Click on the T icon to add labels to the squares and voila!
Congratulations, now you know 2 different ways to create a highlight table!