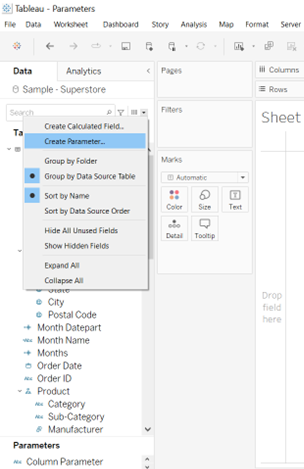
What are parameters?
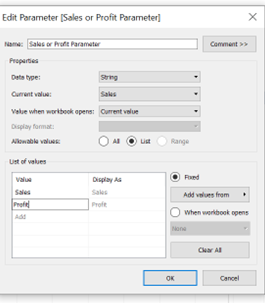
Parameters are the names of fields that you can create (Figure 1). You can choose what to assign to your parameter, such as from already existing dimensions or measures (Figure 2). You can also add values you make up yourself (by typing into the text boxes, Figure 3), in doing so you will be adding a non-existent variable to your worksheet. After, you will need to assign the right data type to your parameter. For example if it was all state names in America, this would be a string.

After creating your parameter, it cannot do anything without instruction. You will need to create the instruction through a calculated field, and what you input into this calculated will depend on the desired outcome.
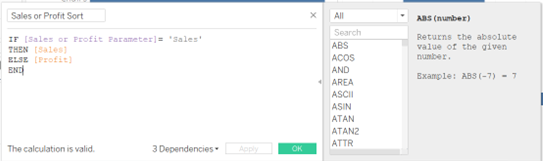
Figure 4 shows an example of two graphs that will sort either sales or profit, depending on which one is clicked.
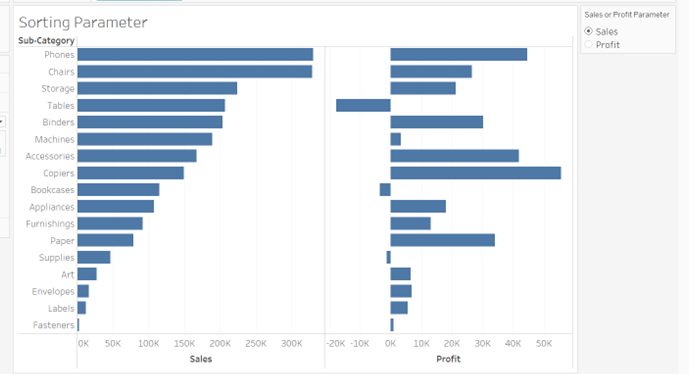
Figure 4a is the instruction given to make this sort occur. Breaking this calculation down: If the parameter (coloured purple), which contains either 'Profit' or 'Sales', is equal 'Sales' then give all the sale numbers. If 'Sales' is not selected then give all the profit numbers.
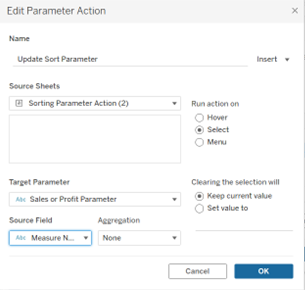
After the instructions are in place, you will need to set an action to your worksheet. This example is set to change once selecting either graph.