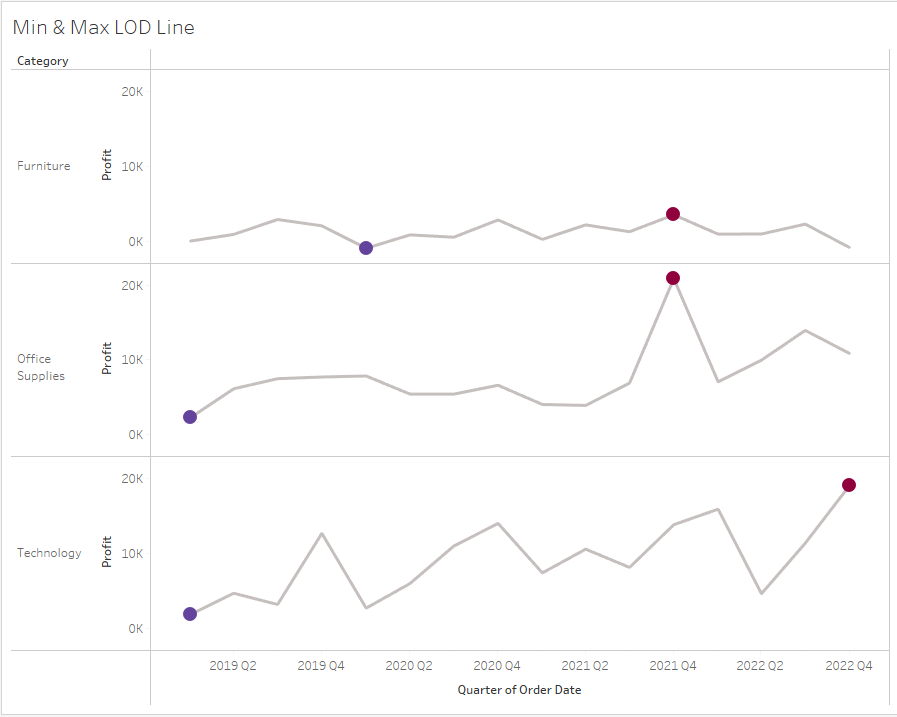
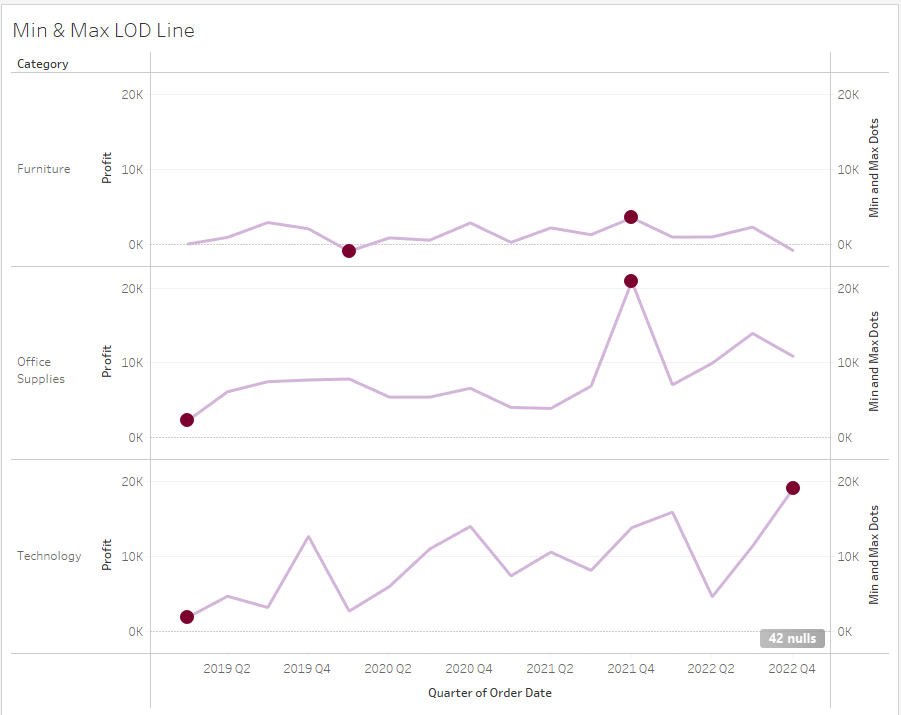
This example uses superstore data and uses LODs to create a point for the minimum, maximum over a period of time.
Building the chart
1st
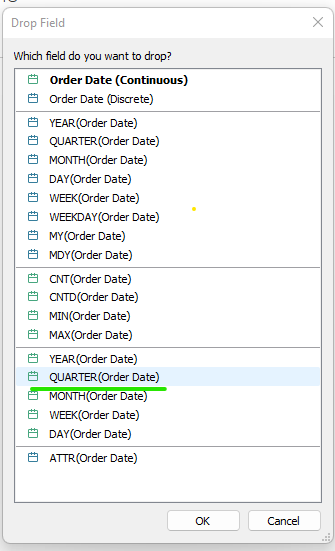
Right click, drag and drop the Order Date field onto the columns. A window will pop up and a continuous date needs to be chosen. The continuous dates are at the bottom and signified by the green calendar icon, whereas discrete dates are at the top and coloured blue. In this example I chose continuous quarter.
2nd
Add category and profit to rows.
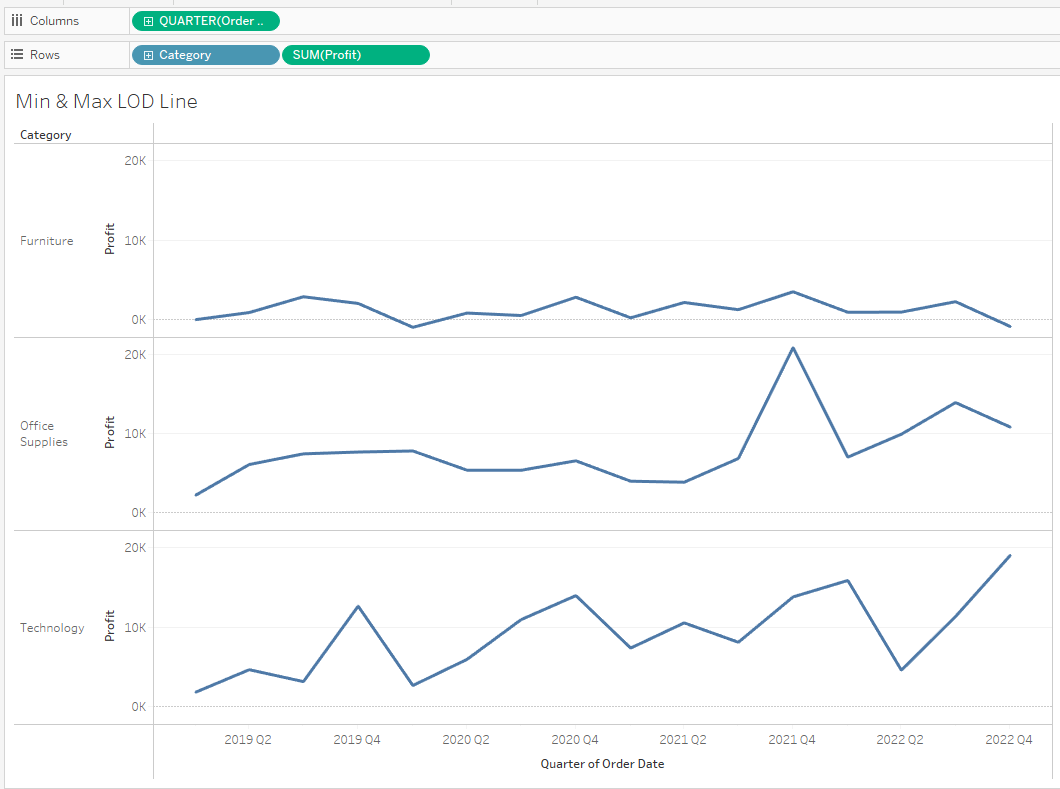
The chart is showing the total profit, for every quarter since 2019 to 2022, split up by the individual categories.
Building the LODs
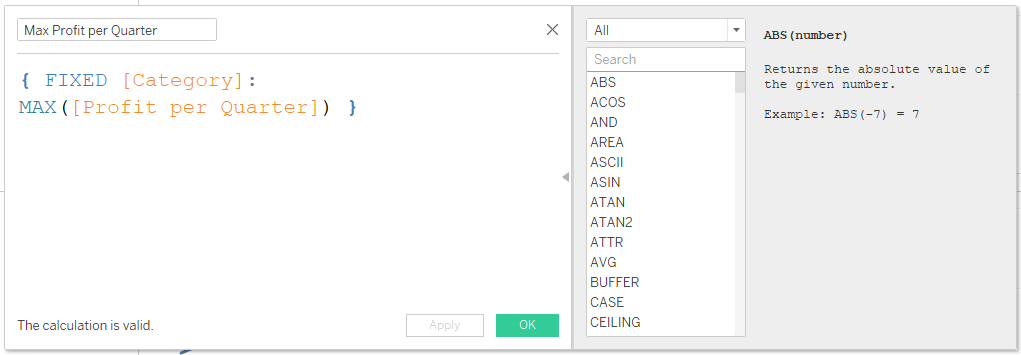
1st
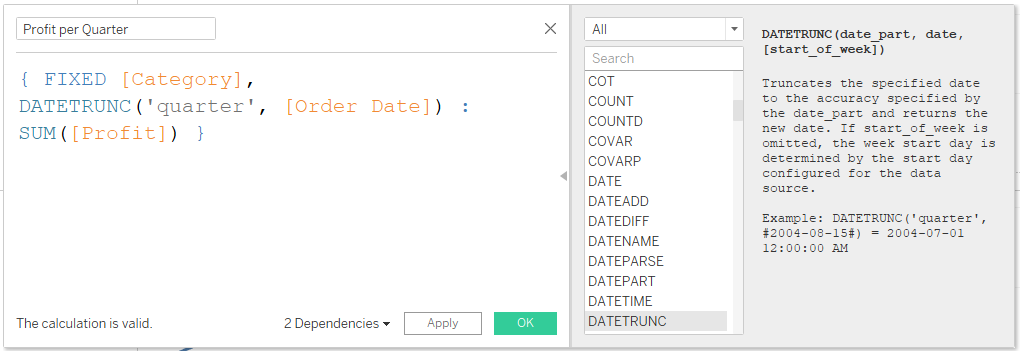
Build an LOD that says: for every category, and quarter, return me the total profit. Call this Profit per Quarter.
2nd
Build two more LODs that find the minimum and the maximum out of all of the values returned from the first LOD calculation above. Make sure to include the 'Profit per Quarter' calculation from before as the minimum and maximum value.

Duplicate whichever calculation you made first to make this process quicker, and just change the MIN/MAX.
3rd
Create a third calculation, which will be used to create the min and max values as dots.
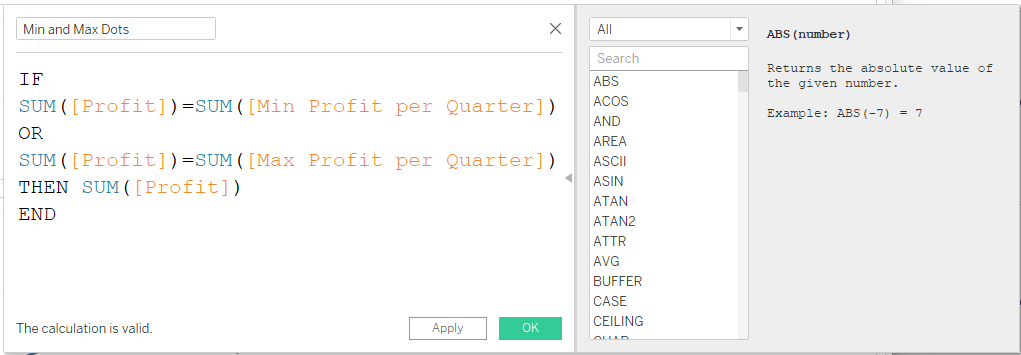
Drag and drop this calculation onto the rows, next to profit.
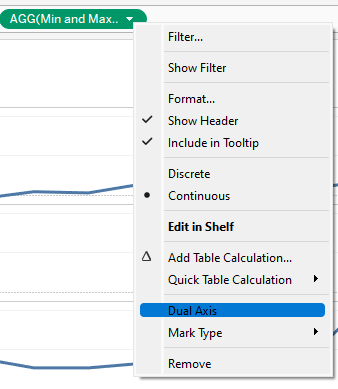
Right click the Min and Max Dots and create a dual axis.
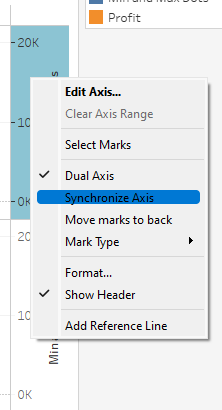
Make sure to synchronize the axis.
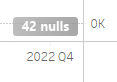
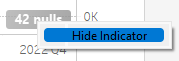
You might notice that in the bottom right of the chart is a message stating that there are 42 nulls. This is because the second dual axis calculation on the rows is only returning 2 values (min & max) for each of the three categories. This is what we want so you can hide the indicator.
4th
Now is just formatting.
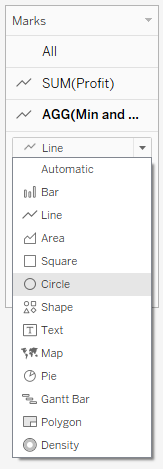
Change the dot calculation on the marks card to a circle rather than a line. You will then be able to make the circle bigger or smaller.
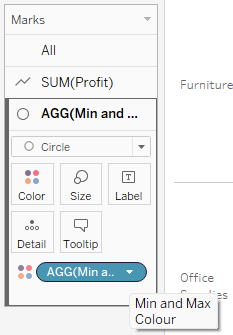
Differing colours
To make the max and min dots different colours you will need to create one more calculation.

Put this calculation onto colour on the marks card of the min and max dot calculation.
Final result