


We started off on the first day with a visual CV in Tableau as our topic and Tool.
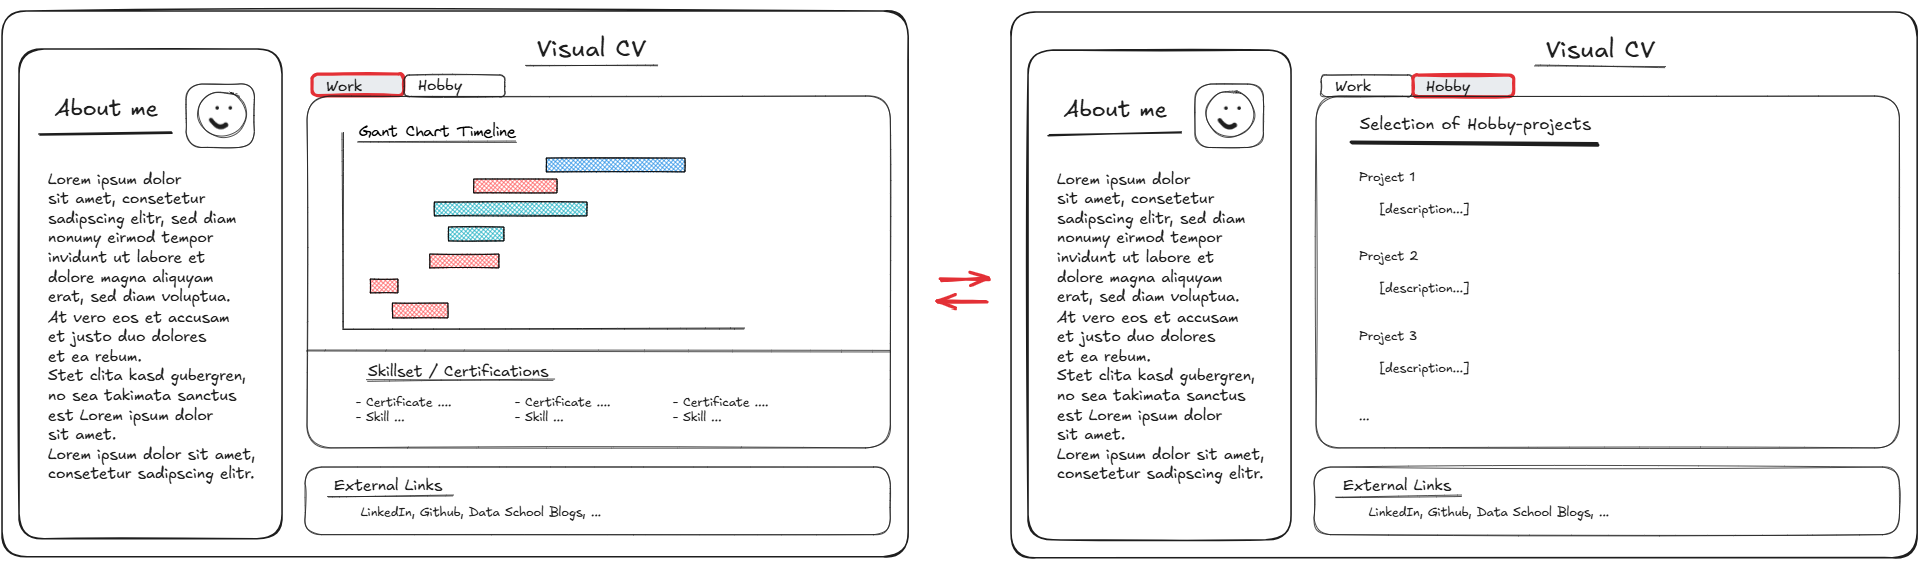
First I looked at some Tableau CVs for inspirations and created this sketch:
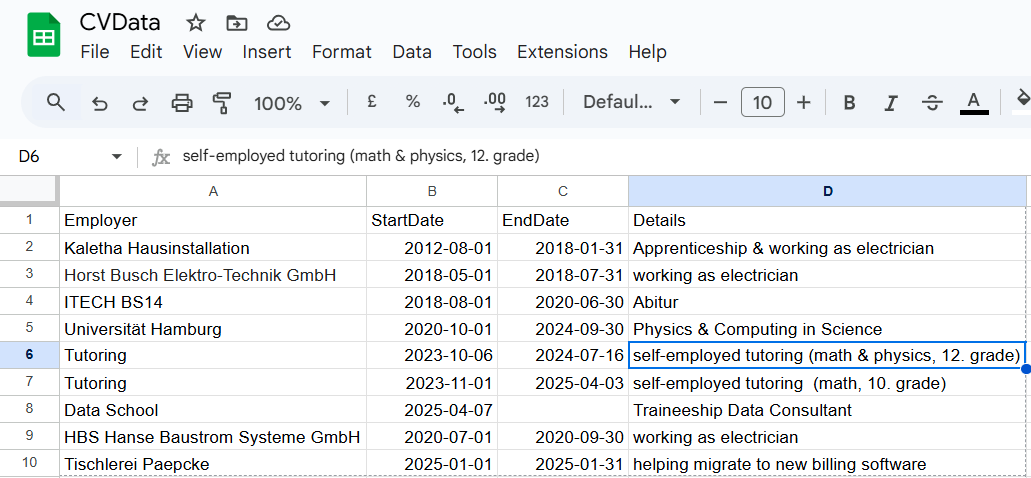
Next there was Data to collect. Not from the Internet or a Client this time, but from my own past. I created some tables in Google Sheets with my work experience with dates for start and end, skill set and links to my socials.
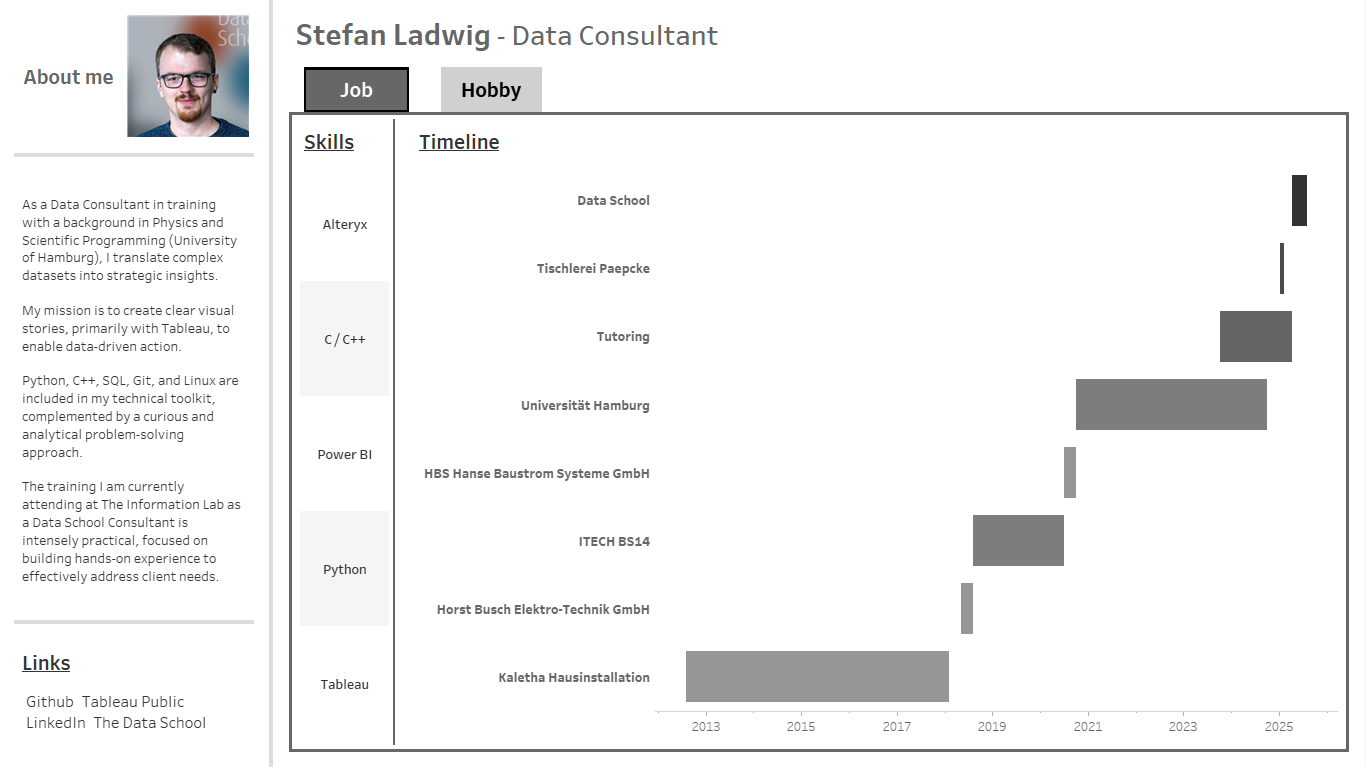
Final step was implementing my sketch into Tableau.
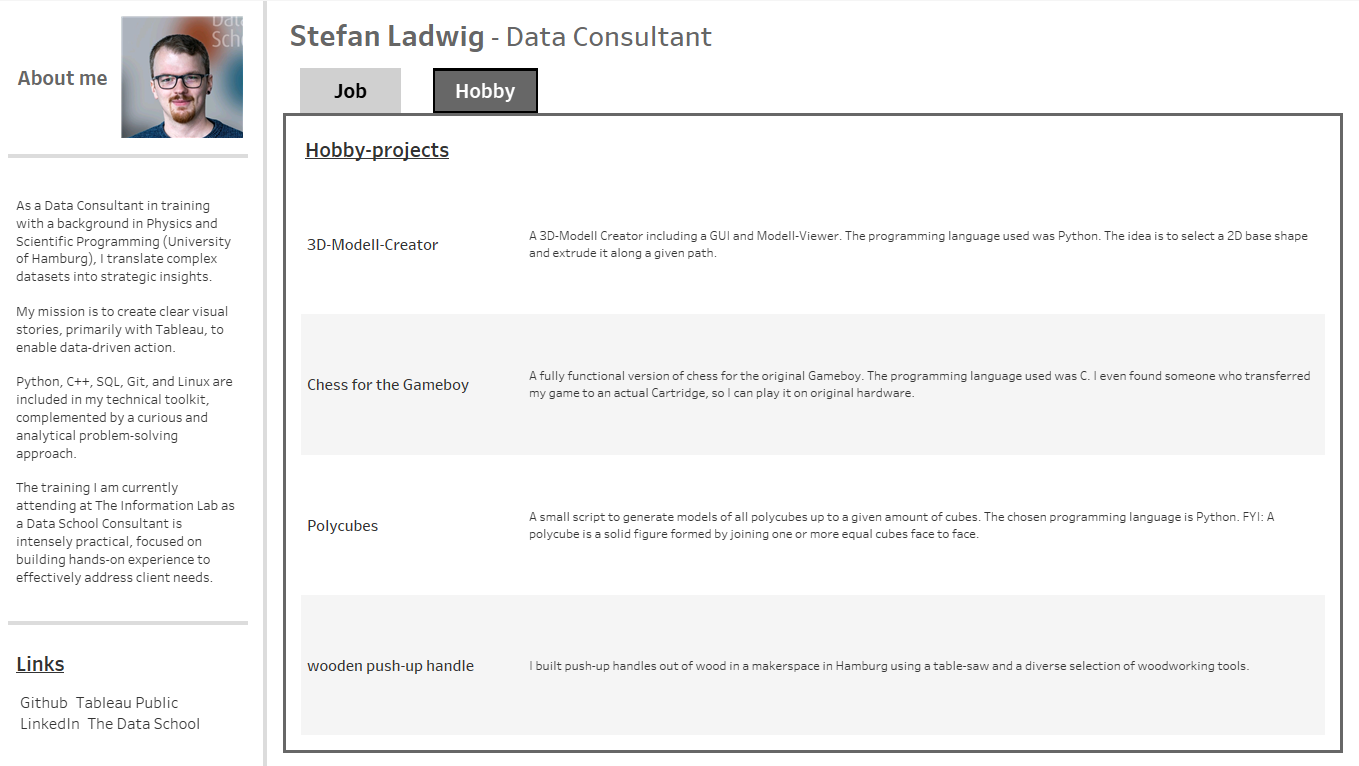
I used dynamic zone visibility and Parameter Actions for the Job and Hobby Tab.
Here is the result:
Next Steps:
Adding some nice icons for skills and links, adding images to Hobby projects and maybe color my Gant-Bar-Chart.