


A wordcloud often is a simple way to connect words to a value (size, amount etc.) and thankfully it is very easy to create one in Tableau.
For a basic wordcloud we only need one field for the words and another for the size. For another information dimension we can use a third field for the color.
How to create the Wordcloud
1. Drag the word field on Text in the Marks card
2. Drag the field which determines the size on Size in the Marks card
3. Make sure the selected visualisation method is set to Text in the dropdown
4. (optional) Drag a field on Colour
Done!
Here is an example using Superstore Data:
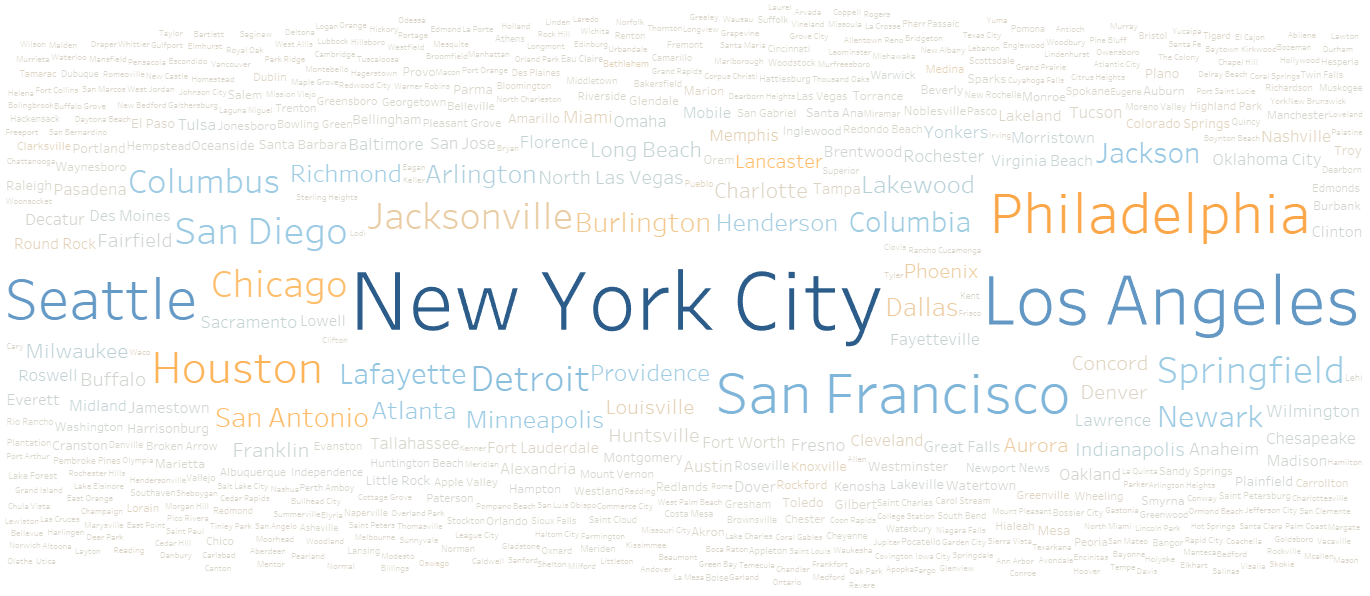
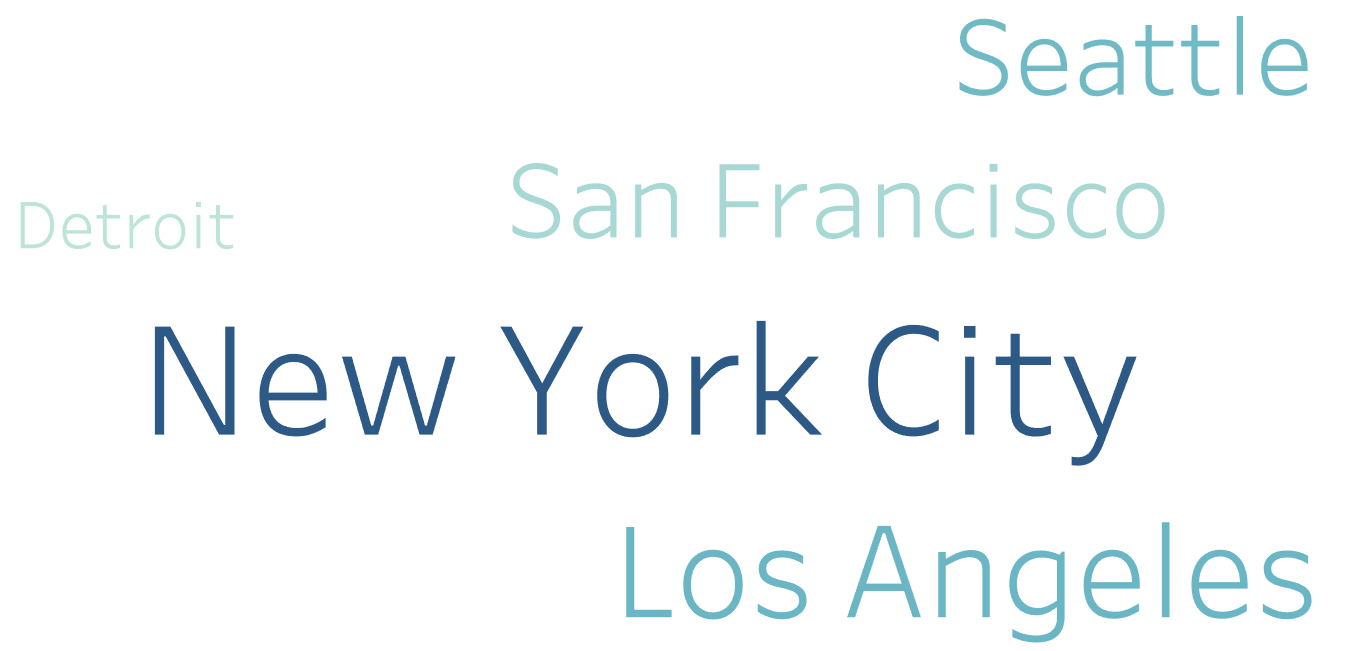
Marks card for this wordcloud:
As you can see in Fig. 1, too many words can use up uneccessary space, if you don't really care about the amount of words.
One way to handle this is filtering only the Top N Words (here City Names).
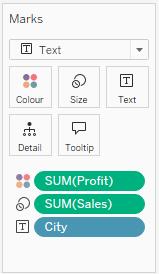
As you can see in Fig. 3, too few words also beat the purpose of this visualisation method (they are filtered to the Top 5 Cities by profit).
So let's filter to the Top 50 Cities by Profit:
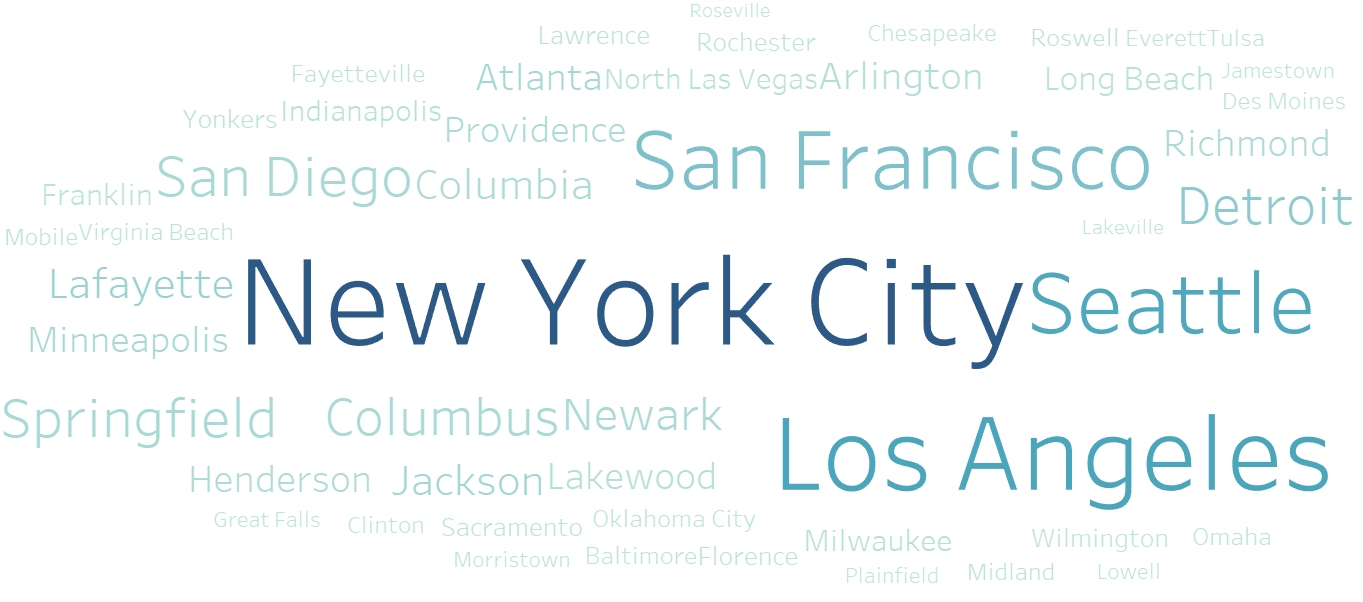
And that's it.
Easy to create, but sometimes a very insightful method of visualization.