


Today I want to show you how to fill up a cup in Tableau.
If you want to fill up something in Tableau, you need a graphic. That graphic can be anything. You can choose a cup, a bottle or a fruit. What ever you want to fill and what ever you want to show, you need a graphic with free space.
I am gonna do it with a cup today.
First step, I need a cup. I search for a cup graphic or a build one myself. You could use: https://unsplash.com/de to find one. For commercial use, make sure it is license free.
Step 2: Cut out of the filling part. So use a graphic edit software or for example following website: https://www.photoroom.com/de/werkzeuge/hintergrund-entfernen
Edit the graphic that you have an empty space, where you want to fill up later.
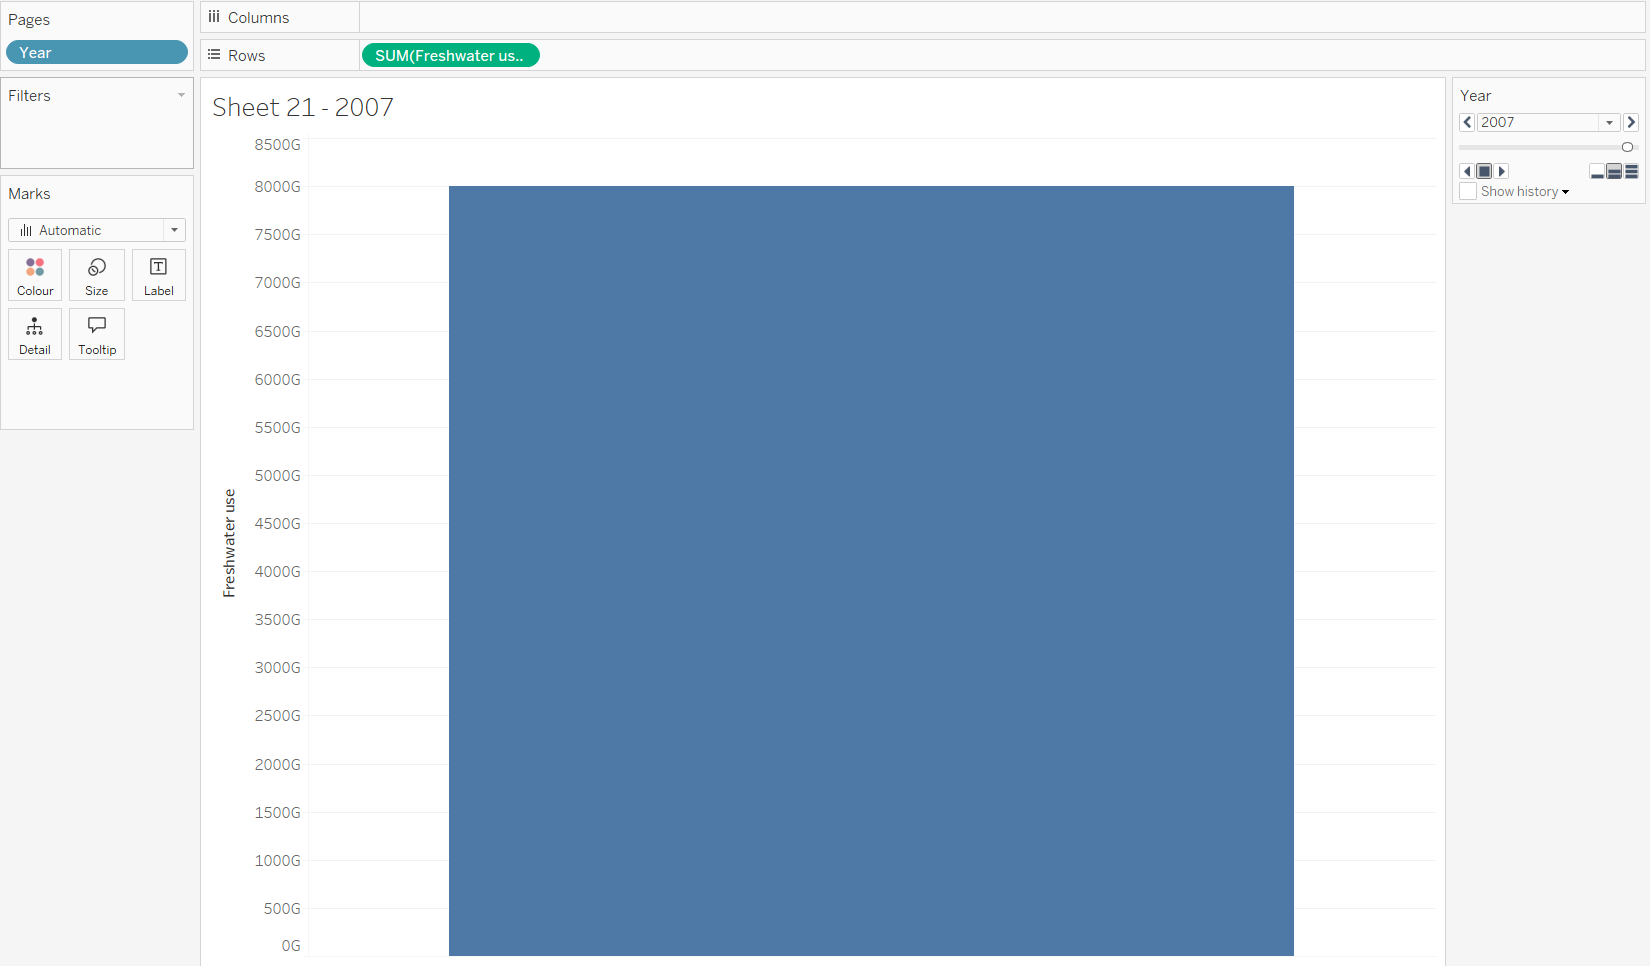
Step 3: Get Data into Tableau and create a bar chart. For the topic I am going to use the following Data about Fresh Water use over the years:
Step 4: Now use the page function in Tableau (left upper corner). We but the amount (in our case Sum(Freshwater)) on the rows. And use the measure Year in the Pages.
Step 5: Create a Dashboard and insert the image of the cup.
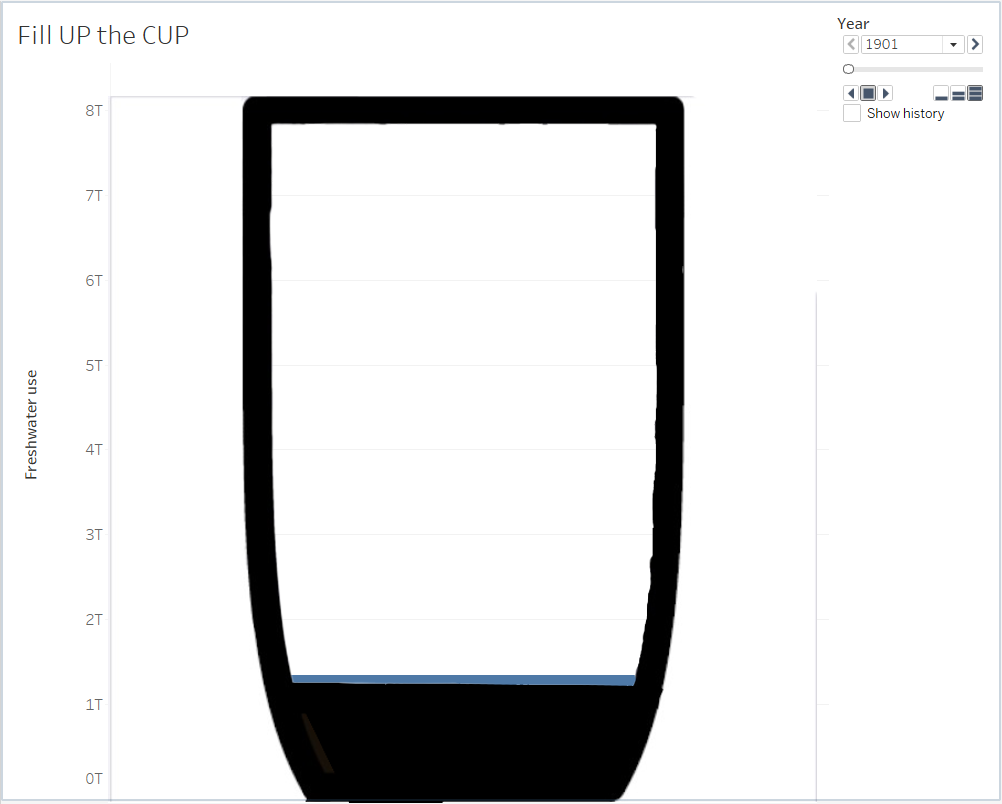
Step 6: Start the animation and the bar chart rises up, so it looks like the cup fills up.
Enjoy filling cups up with Tableau 😊.
If you want to have an example with bottles have a look here:
