


In Tableau, there are many different ways to display a filter - You could use a dropdown menu, a list, a slider, or a multitude of other options. However, what if you wanted to implement a keyword search filter? It isn’t something natively offered in filter settings, but implementing it is not as hard as it may seem. By following the 3 easy steps below, you will learn how to make one of these for yourself!
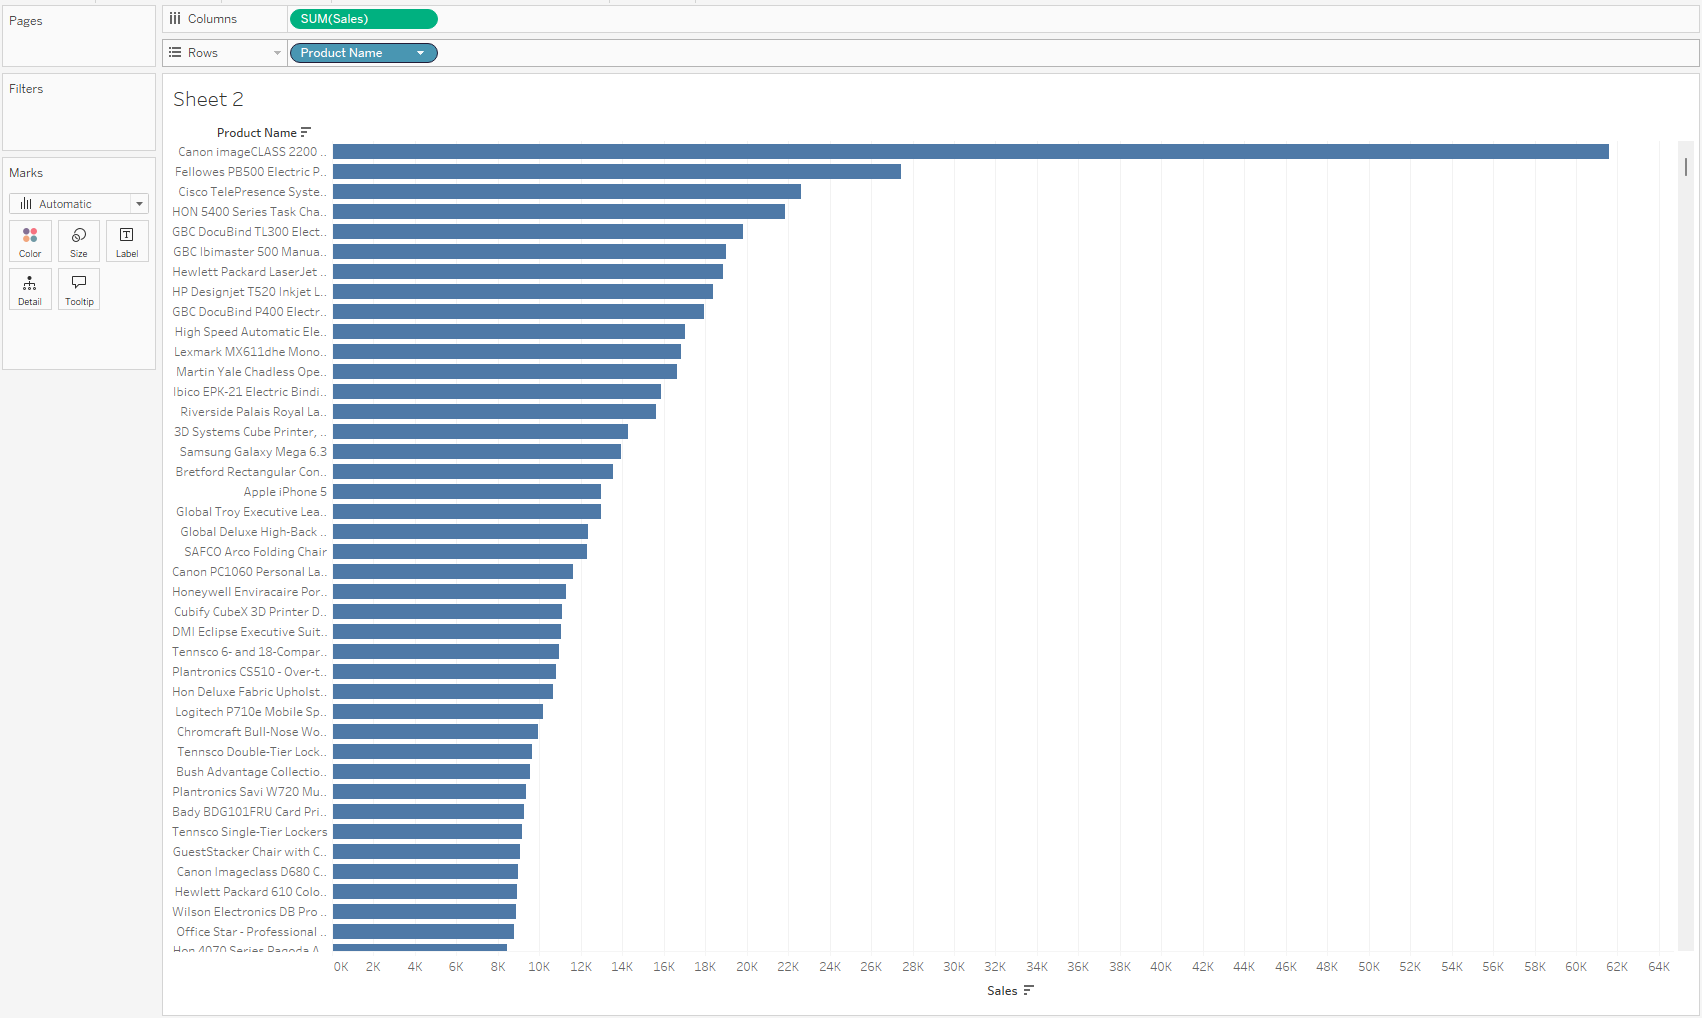
The photos supplied in this blog are from a workbook using SuperStore data, and the graph that I will be using for this demo is a simple sales by product bar chart! If you want to follow along with this example, open up a fresh workbook, connect to SuperStore, and place [sales] on columns and [Product Name] on rows.
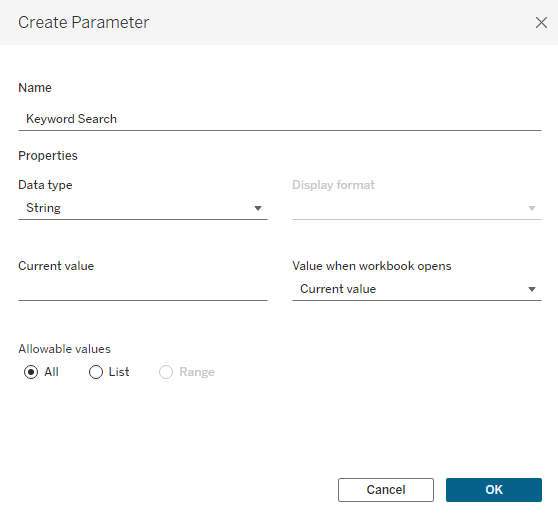
Step 1: First, we will create a parameter that will act as our keyword search bar. In this parameter, we will want to set the data type to String and allow all values. For current value, you will want to leave it as an empty string. Once this parameter is configured properly, right click on it in the data pane and select ‘Show Parameter’.
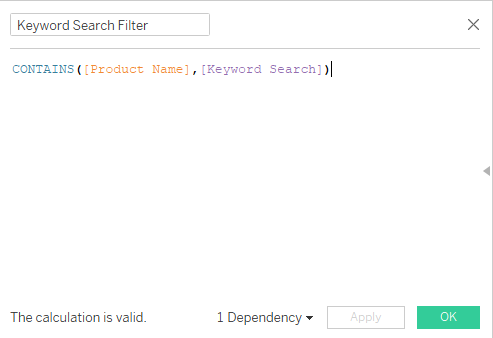
Step 2: Next, we will create the calculated field that will use the value in the Keyword Search parameter to filter the dimension we have in the view. This calculated field makes use of the ‘CONTAINS’ function in Tableau. Basically, it will return all products whose name contains the String in the Keyword Search parameter. Note that contains searches the entire string, so the leave in all product names where the search value is present *AT ALL*. If you wanted to limit the filter to only pull product names that *BEGIN* with the String in the Keyword Search parameter, you would use the ‘STARTSWITH’ function.
Step 3: Now, we can bring our calculated field into the filters shelf. Once it is brought there, select ‘True’ and begin testing keywords! You should find that your chart now can be filtered by keywords!