We had a rocky start at the beginning as we didn’t have any data, luckily just before 10:00 we received a dataset to work on. It was pertaining to salmon and trout fishing by net or rod in Great Britain. The question I first tasked myself with answering was; Is Salmon more popular than Trout for fishermen?
Having done this, I asked a few more questions that would help structure the data.
- Is net or rod fishing more popular?
- Where are they mostly caught?
- What sort of amounts (weight/count)?
- What was the release rate?
- Is this representative?
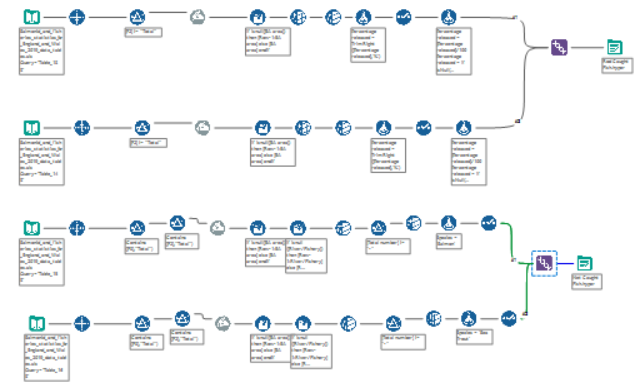
I built following Alteryx Workflow to prepare the data for Tableau;

Challenges:
- The original data was an ODS file which is not accessible to Alteryx, however it can be opened and the saved as an Excel file
- There was a lot of miscellaneous data and totals, as a result I used the select records function and filtered out any cells containing total
- There were null cells due to merge cells, thankfully it was a simple multi-row formula to fill all the null rows
- Cleansed the rows of leading spaces and removed punctuation in order to change some data types into numeric fields
- Unioned the separate salmon and trout fields in each to produce a net caught table and rod caught table, added a column to help differentiate the species as well


Now onto the Tableau portion.
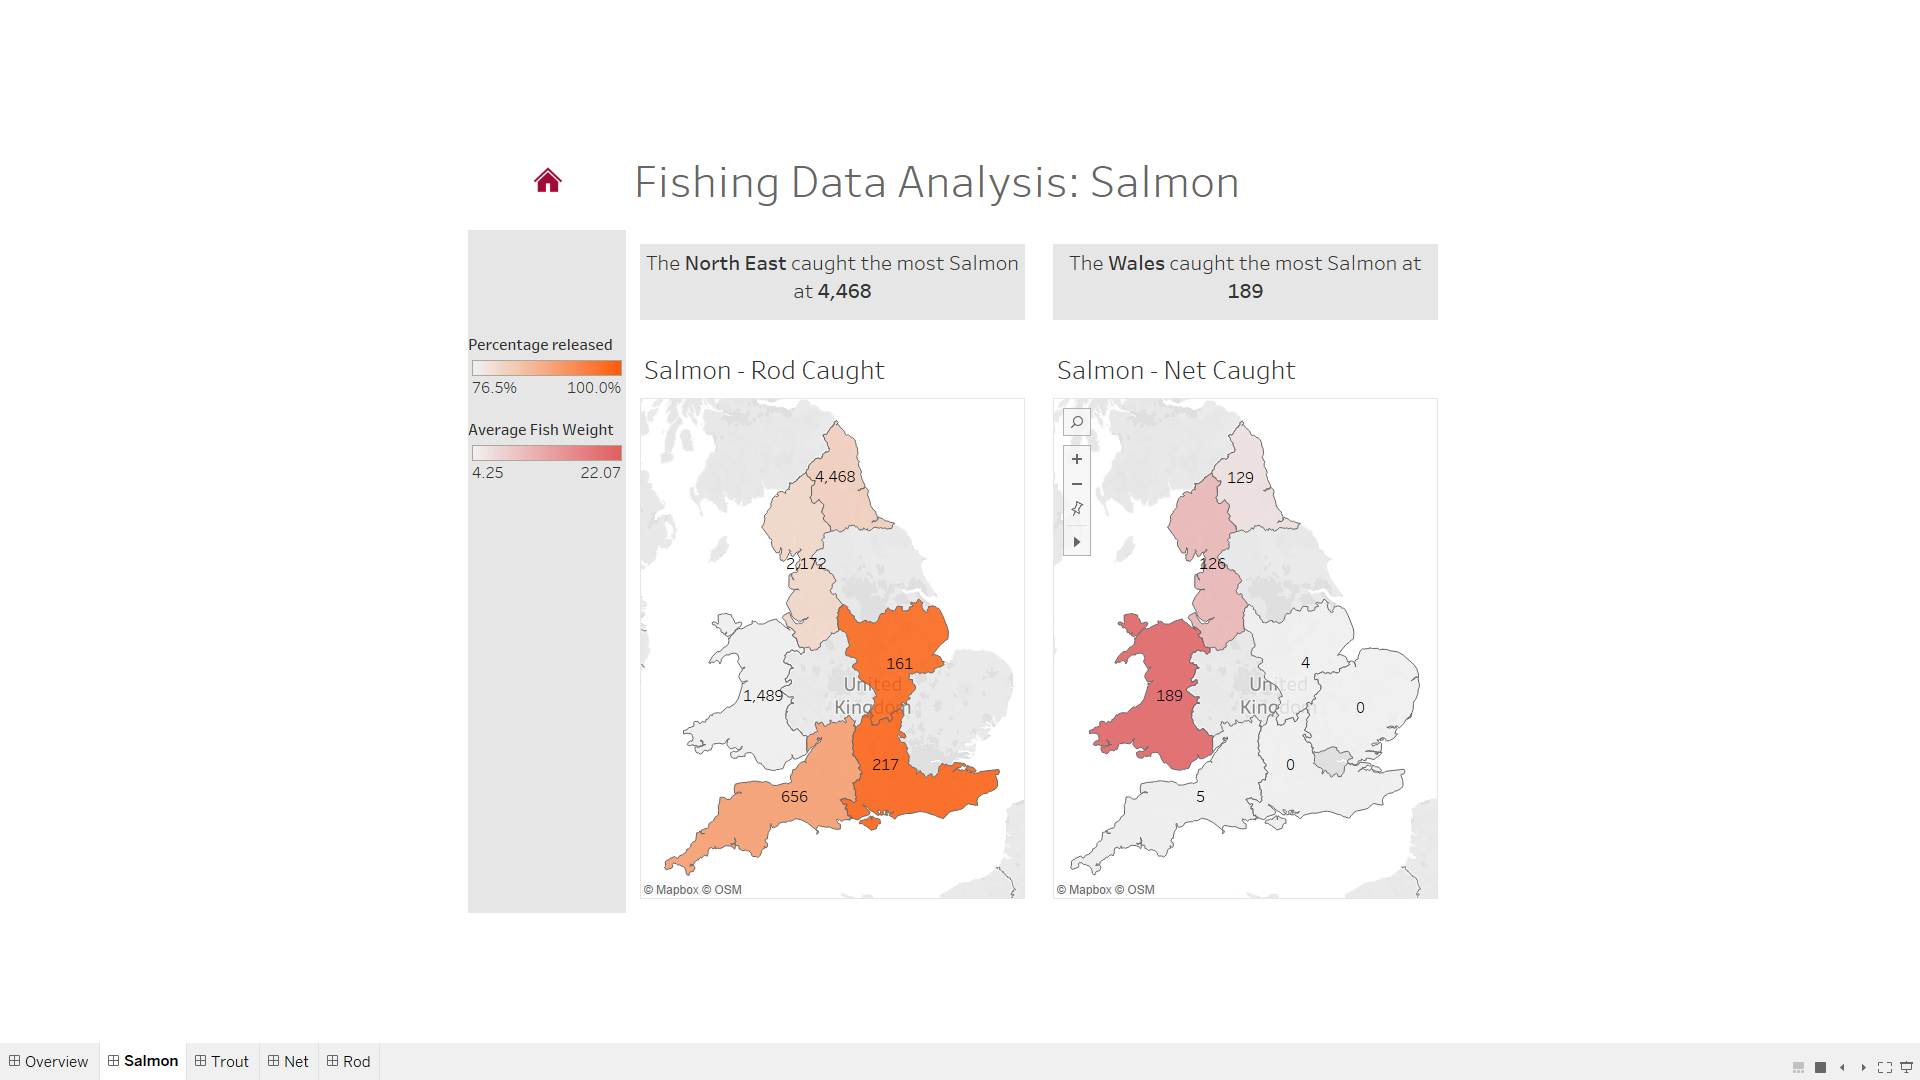
The problem with the data was it was fairly limited and insights were therefore replicated. However I decided to split the data 4 ways and create a landing dashboard to navigate between them and allow for easier comparisons.
My initial question was quickly answered, so I moved onto some of the other questions. Ultimately, these too were quickly answered. I opted to use the same style of charts, i.e. a map, to provide consistency throughout for comparisons. These maps were made by matching the NUTS 1 regions to EA on the dataset. I also spent a fair amount of time fruitlessly searching for semi-relevant river basin spatial objects.
I am not especially enamoured with my dashboard style and if I had more time, I would work on polishing it up using a theme, different fonts, more interactivity, etc.
Having said this I did use colours of the fish orange/pink for salmon and some of the colours on the colour palette for trout.
I attempted to incorporate new data, however, much of the data was at a higher aggregation than the initial dataset and often included Scotland (omitted in the original), which had by far the largest share of fishing. In the end I opted to use the tables on pg 37 of this government document and tried to incorporate that into the overview having used Tableau’s inbuilt pdf table converter alongside the data interpreter.
Attached is the final product;

In conclusion, the first day of Dashboard Week was interesting. There were a few hiccups but I am overall happy with the result. With more time I would add more interactivity and use excalidraw more fully to prepare the data structure and dashboard outline.
For future DS’ers some of my recommendations are;
- Take 10 minutes to look at the data and come up with some questions you want to answer (some may be possible others not so much)
- Use Excalidraw to map out the data structure you want and pick your preferred tool
- Write a to do list to help get your thoughts in order e.g. what level of granularity in the data are you looking for? Did you change the tooltips in the dashboard? What about the padding? Etc.
- Once you have planned out the initial phases of the day write some times to check in times e.g. I said I wanted the dashboard done by 13:30 so I could start writing the blog post. Getting additional data and spatial were bonus requirements, so I set times to judge how far along I was and whether I could integrate them. How much time do I need to get some useful insights for the presentation? etc.
- Remember to take breaks (it will give you that clear second look)
Best of luck for you dashboard weeks!
