Final day of Dashboard Week and somehow we have all managed to survive! Today was the “fun data” day and we were tasked to download data from the series Breaking Bad from an API. The API was very well documented and easy to understand so it was a joy to work with and fairly straight forward to pull out the different tables in a usable format. Here’s my Alteryx flow:
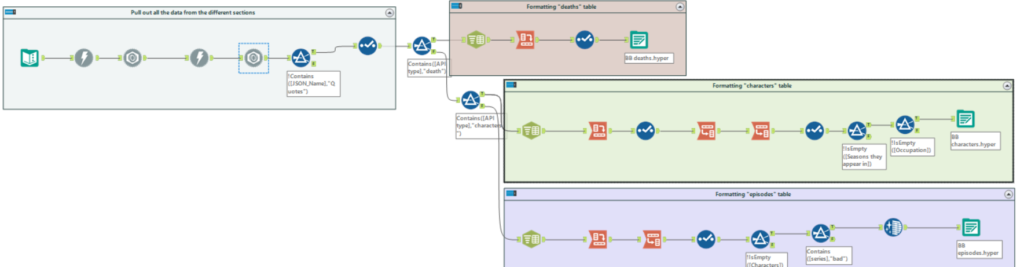
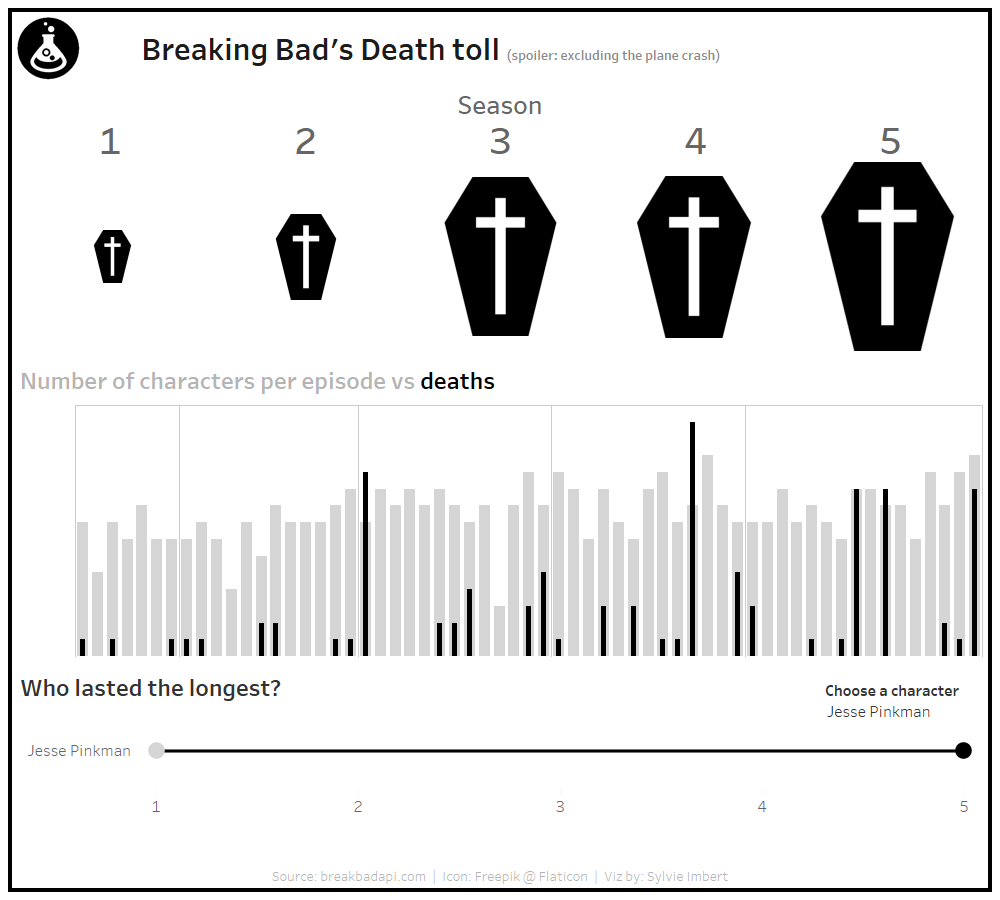
I pulled out the characters, episodes and “deaths” tables and having never watched the show before (don’t tell Andy), chose to focus on the “death” aspect. We only had 3 hours today to produce a dashboard from start to finish, so it doesn’t have much analysis but still produces some insight.