For this blog I will be explaining what accessibility is and what I had to do for my dashboard. This will be followed by what I would do to improve.
So First of All What is Accessibility?
Accessibility is the practice of making information, activities, and/or environments sensible, meaningful, and usable for as many people as possible.
What are some reasons a person might have difficulty interpreting a Tableau dashboard?
- Colour blindness - There are 11 types of colour blindness. The one that most people forget is some people cannot see colours at all.
- Visual Impairments - Some people might be blind, partially blind or have short sightedness.
- Motor impairment- this could mean they might not be able to interact with a dashboard as they are unable to use a mouse.
- Difficulty reading - This could be because of dyslexia or due to the culture they are from they may have never got taught or even because there maybe a language barrier.
- Neurodivergence- this can be the way the individual processes information for someone with dyslexia or dyscalculia or ADHD, etc.
(These only include some examples there are many more which may full into these categories or other categories all together but this is just an idea of the different accessibilities that we should try to cater for).
Dashboard day 1- Task
We’ve decided to take our own advice and try to get TIL’s sales staff to use the Sales Performance chart, which was greeted with a lot of enthusiasm in the sales meeting - except one. Olu shifted in his seat before raising his hand and telling everyone that he’d never used the report, though he knows it's there, because his dyscalculia means the report literally gives him a headache to interact with. Tom and Robin realize they need a solution which Olu can use but aren’t sure where to start. How could you help them build a report that all of TIL’s current and future staff can use?
For this we were trying to use Retrofitting to make these dashboards. Retrofitting is taking something that exists and adding new features to this.
What is Dyscalculia?
Dyscalculia is a specific and persistent difficulty in understanding numbers which can lead to a diverse range of difficulties with mathematics.
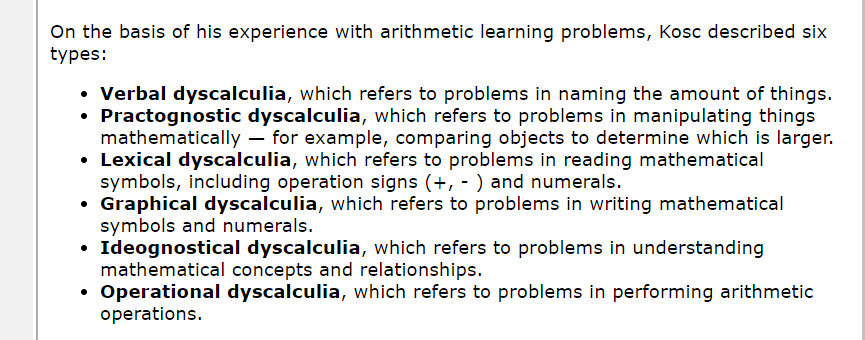
When researching this we found that there is 6 different types of dyscalculia. So we had to ask what one to focus on. These were the 6:

Our focus was those who struggle with the interaction of a dashboard.
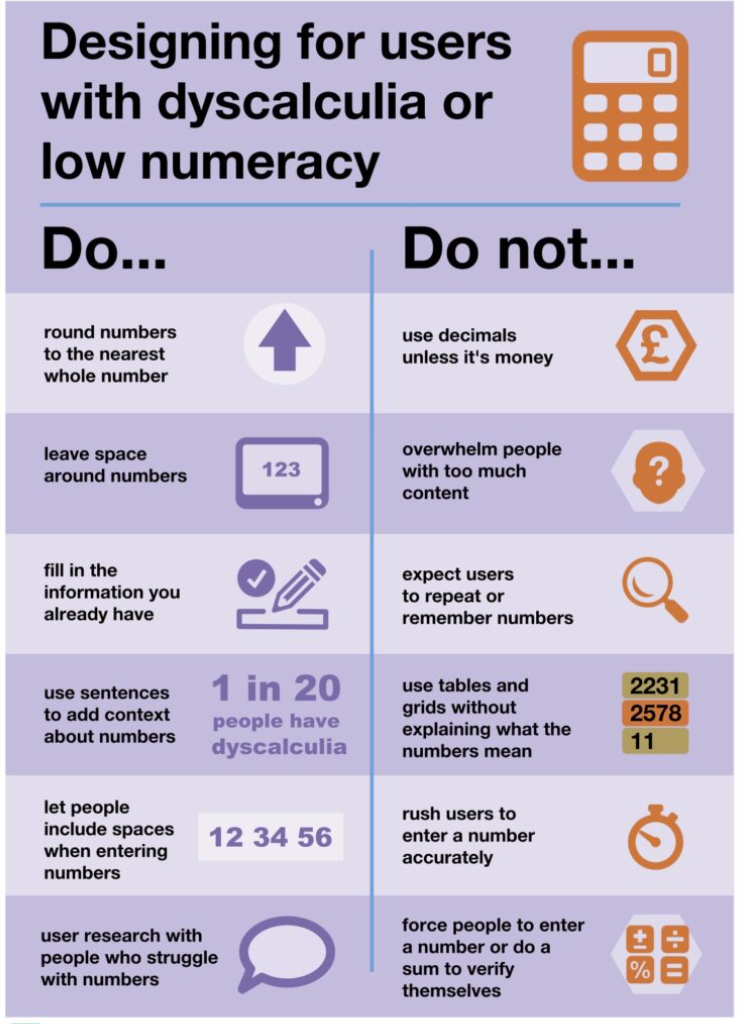
After researching this we looked to see what the government guidelines are as shown below:

For the dashboard we were trying to retrofit. We realized that this dashboard itself was very complicated. Our plan was to keep it as simple as possible by splitting it into sections to show individual charts and using dynamic zone visibility to switch between the graphs. Unfortunately where we were doing so much we were unable to finish. Because we had simplified the charts significantly we should have titled and labelled our dashboard better to make it easier to use.
What I would do differently?
- Speak to sales team and understand the charts itself.
- Make sure to label the parameters- make it clear to the user.
- Do not over scope.
