


These two concepts we use all the time but what actually are they. This blog looks at the difference and also shows an example of when it might be used.
Measure Name: This contains the names of all measures in your data, which is collected into a single field with discrete values. #Blue breaks up the view the colour of this pill is blue which will allow you to break up sections by using the name and will include profit and sales for example.
Measure value: This contains all the measures in your data, which is collected into a single field with continuous values. If you drag individual measure fields out of the Measure Values card they will be removed from the view. #Green what your breaking up this is a green pill. This is the values of what they consist of so would be the sum of sales and sum of profit- (sum of is the default this can be changed depending what you want to accomplish).
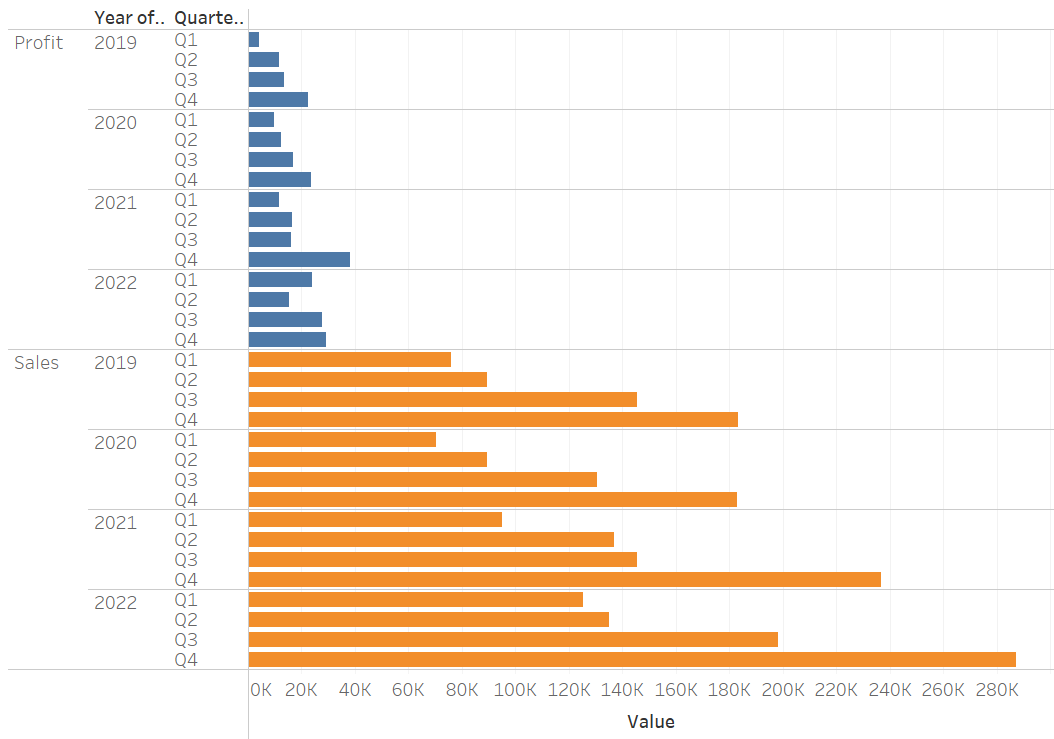
The best way to understand is to look at an example. This is the graph in which we wish to create.
To do this first plan and think how would you create this. I started first by working out what we need in the y axis and x axis
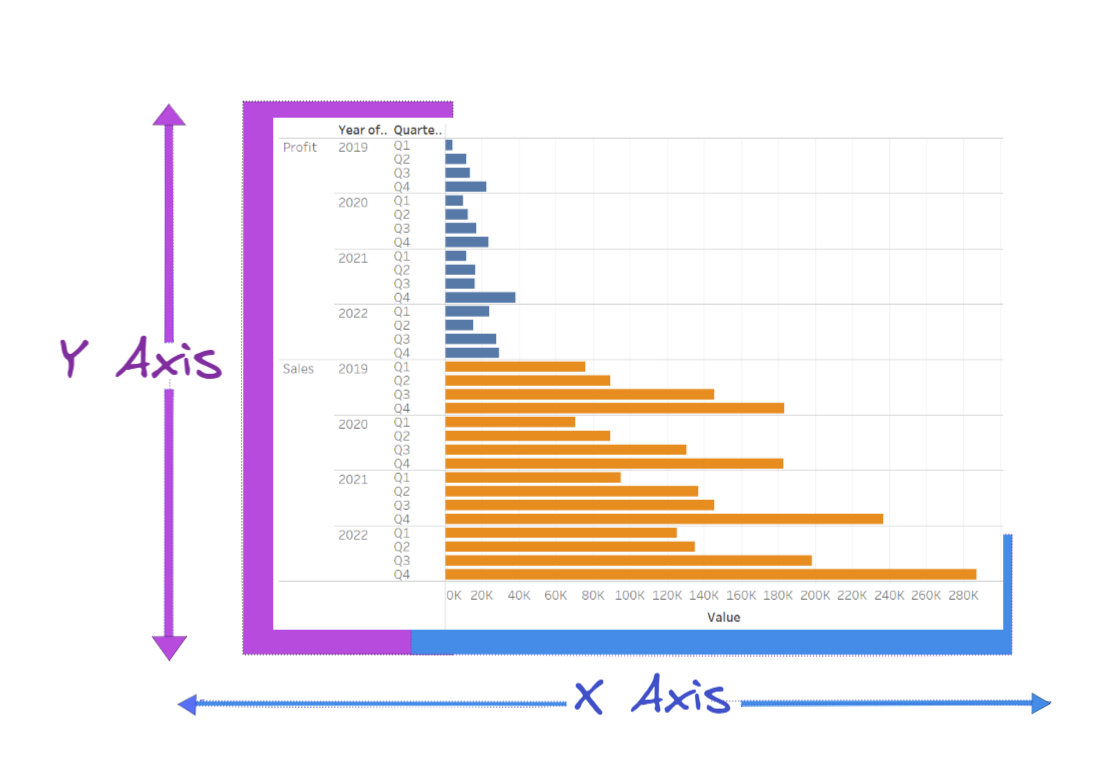
So in the y axis we need: Measure Names, Year and Quarter
In the x axis we need: Measure Values
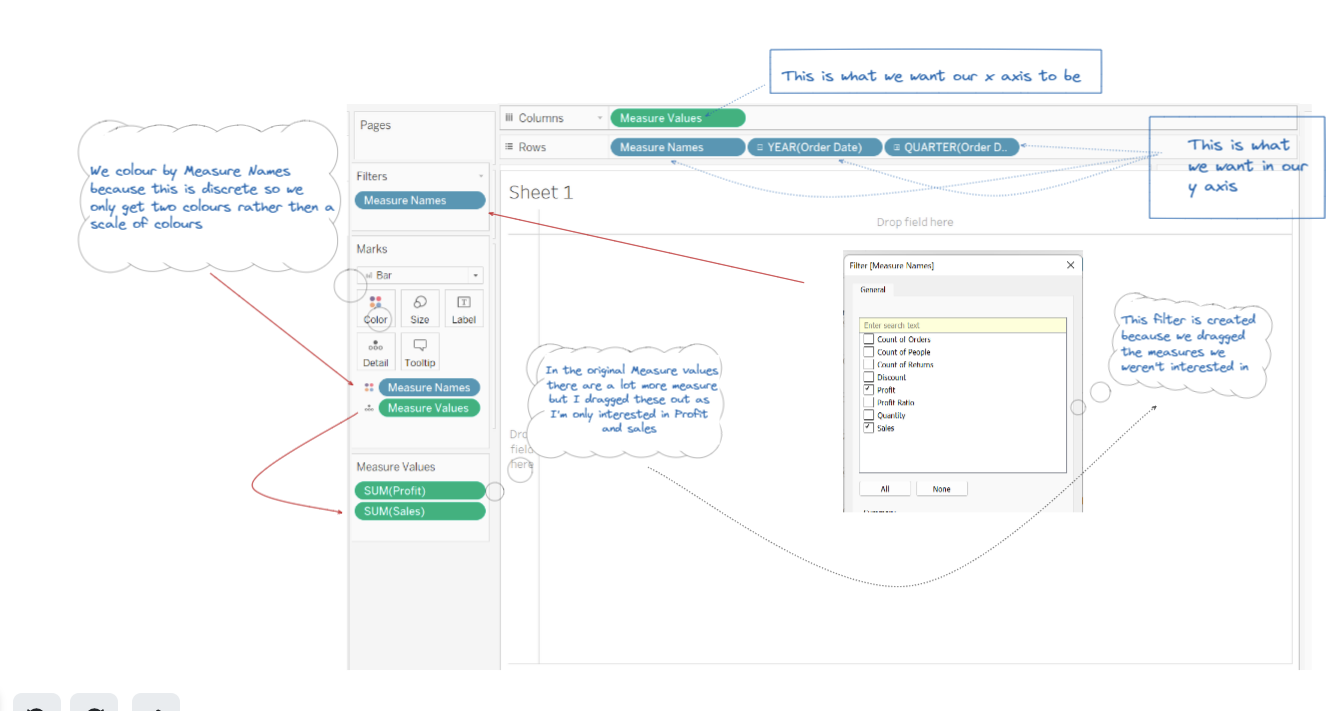
Above shows why we have done each thing.