


This blog is going to show how you would go about sorting table calculations. In particular total percentage. This will show a walkthrough on how this is done. The data for this will be looking at imports and exports for each country.
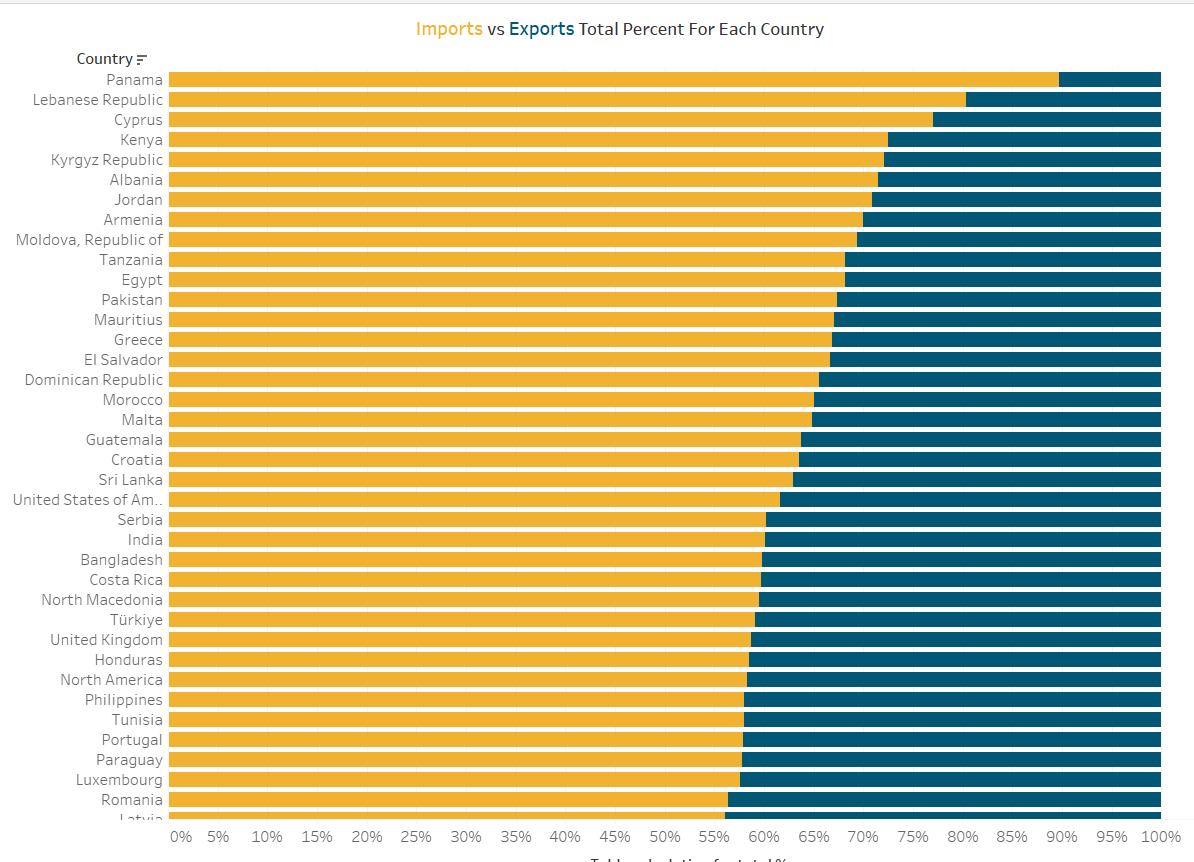
This is what the output will look like:
So Why Do We Want to do This:
In this example we will be looking at imports and exports. So when it comes to comparing it easier to see who as a country is importing more and those who are exporting more when sorted. Otherwise you will have to look longer then 10 seconds to find this.
How to do this:
In short you can't do it as it currently is. You need to use an LOD. This will allow any areas that are in the field/ not in the field to be used to allow the sorting to happen.
So this is how you create the original chart and what happens when you try to sort it.
So in order to sort by imports % we need to first need to get the import % for each country. To do that, we just need to grab the raw values related to imports, and divide that by the total raw value of that whole country. The LOD will look something like:
{ FIXED [Country] : SUM(IF [Imports/Exports] = "Imports" THEN [Value] END) } / { FIXED [Country] : SUM([Value]) }
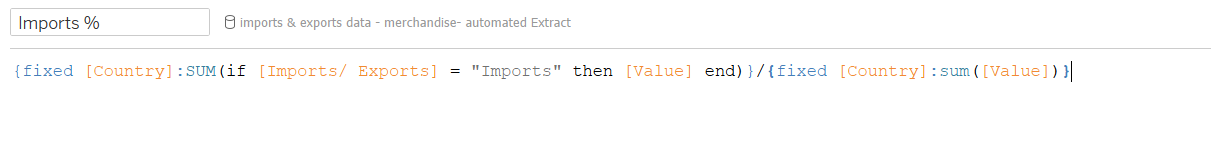
The top LOD is going to get every countries import values, and the bottom LOD is getting the total value for the country.
To sort we just right click on your dimension, press sort and select this new field we have just created. Finally we want this to be descending.
Tip
If it does not work it might be you have missed something in the LOD. For myself I originally forgot to add country to the LOD which was the dependent which determined whether it worked or not.