Today I joined a workout Wednesday 2022 week 13 on spatial graphs this was really fun challenge to test my spatial knowledge. Spoiler Alert I will be walking through how I did this.
What is spatial data:
Spatial data is Spatial data is any type of data that directly or indirectly references a specific geographical area or location.
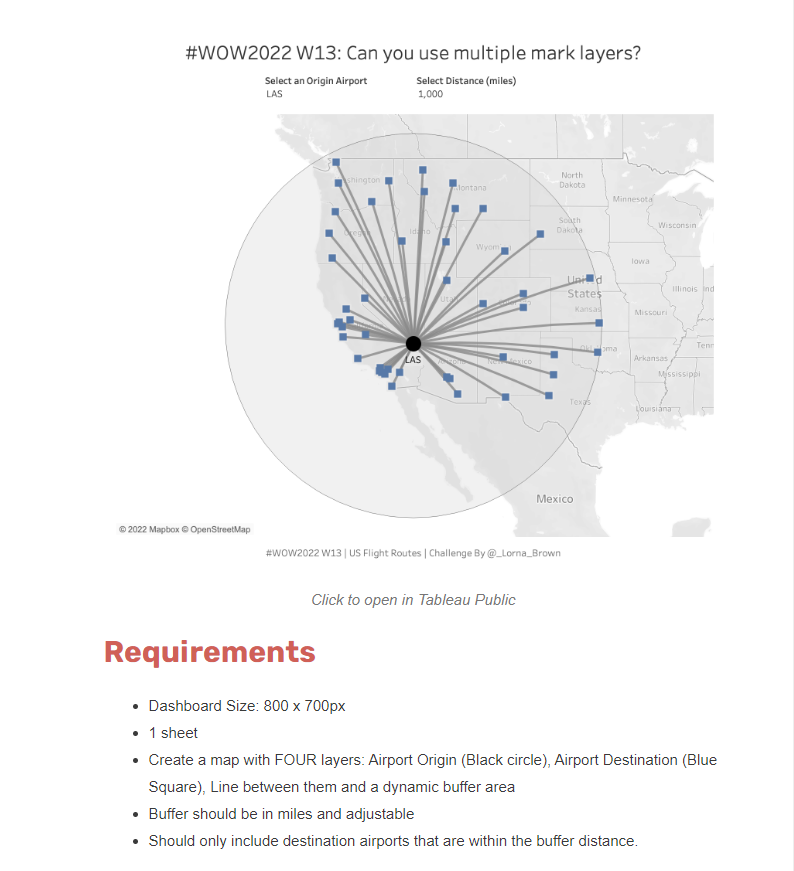
The task that was given to us
My first attempt I had managed to get the origin location which was LAS to show journey by a line to the destination location and realized that I had not layered my graphs.
So this is a step by step guide on how to get to the results.
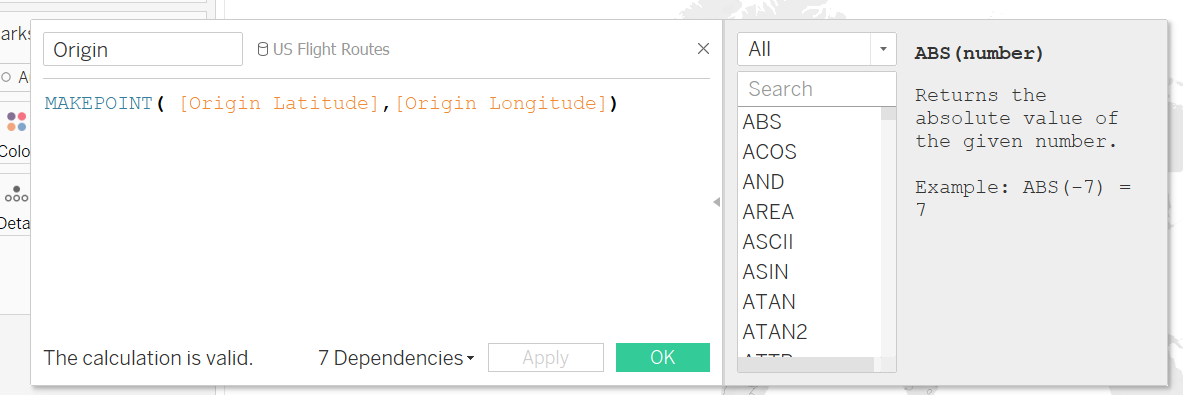
First lets create makepoints for both origin and destination.
Makepoints turn Converts data from latitude and longitude columns into spatial objects. To do this you create a calculated field. The first one we want is for the origin location.
Then do the same for destination. Make-point( latitude destination, longitude destination).
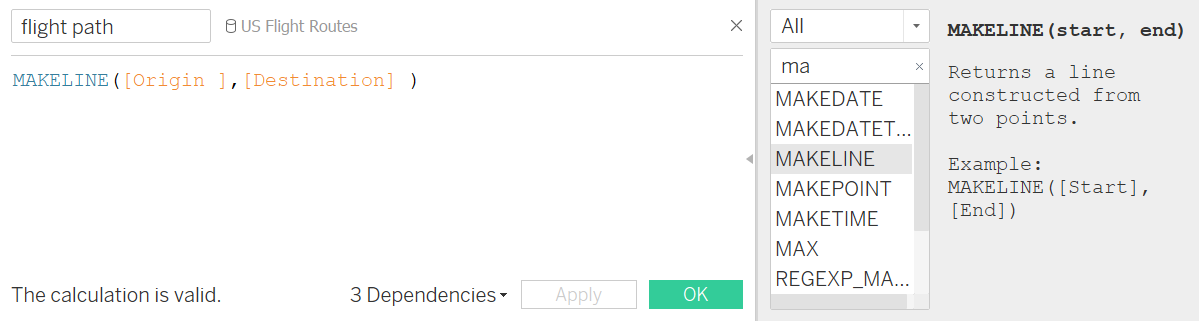
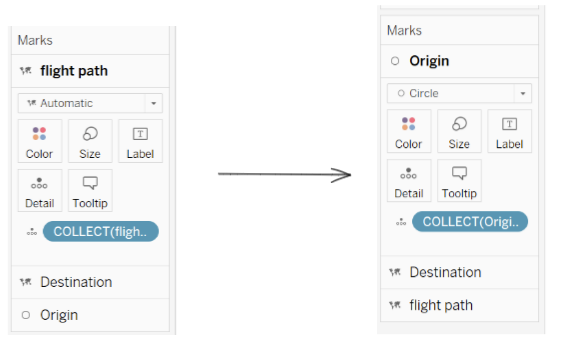
Now we can make a mark-line this will draw a line from origin to destination.
This will allow your destination to be on same graph as origin but we can allocate a different shape for this exercise we will use square. Once again we are going to need a calculated field where this time we do mark-line( origin, destination) I called mine flight path.
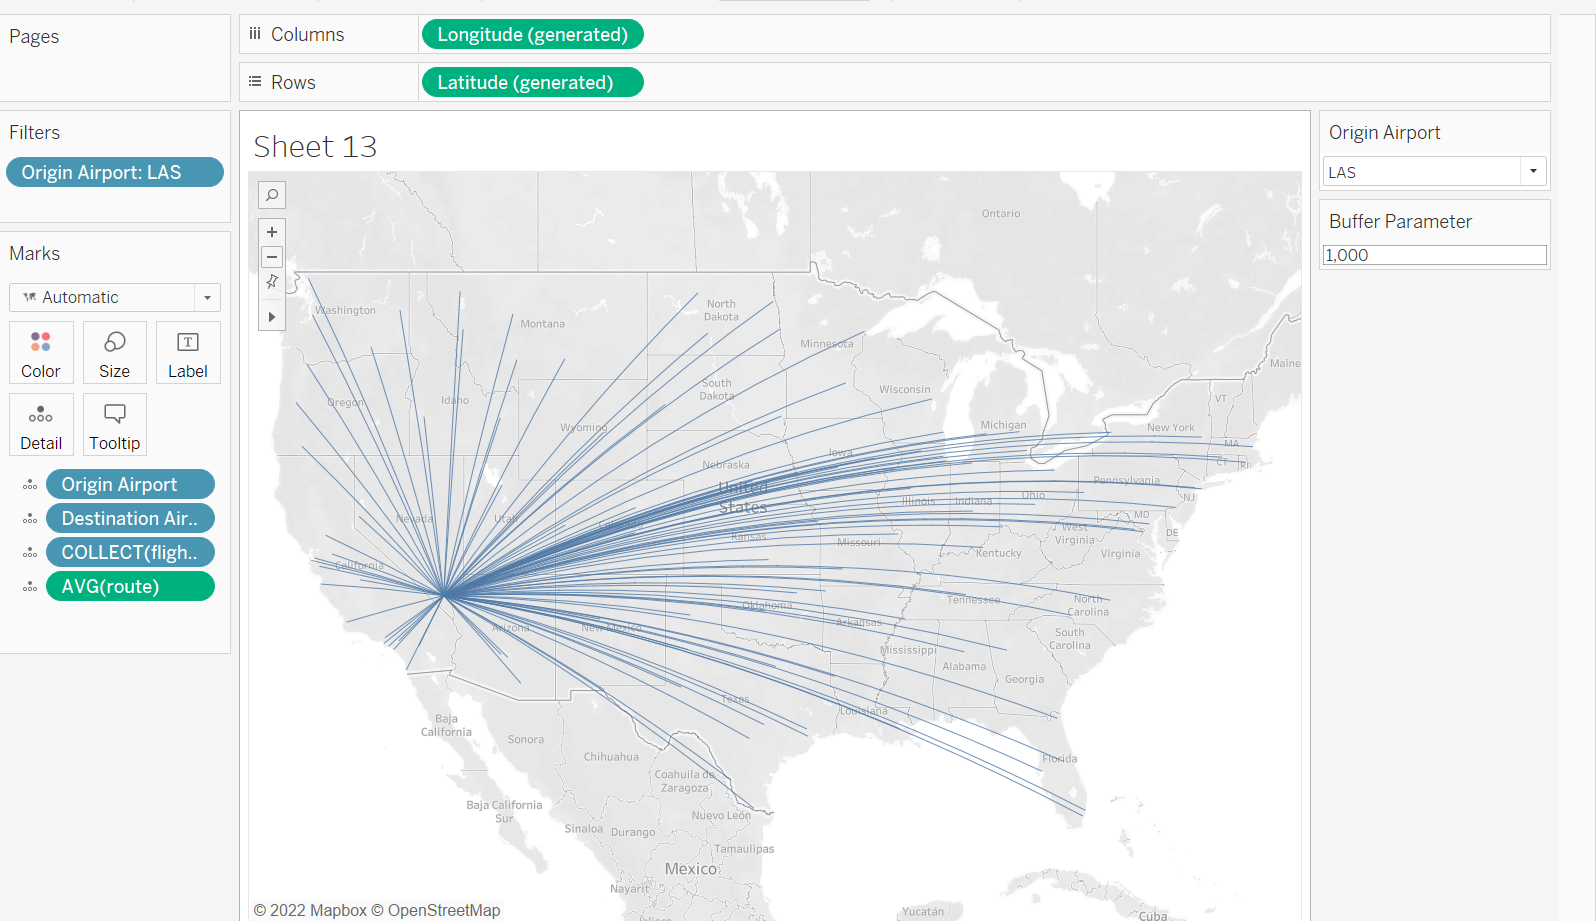
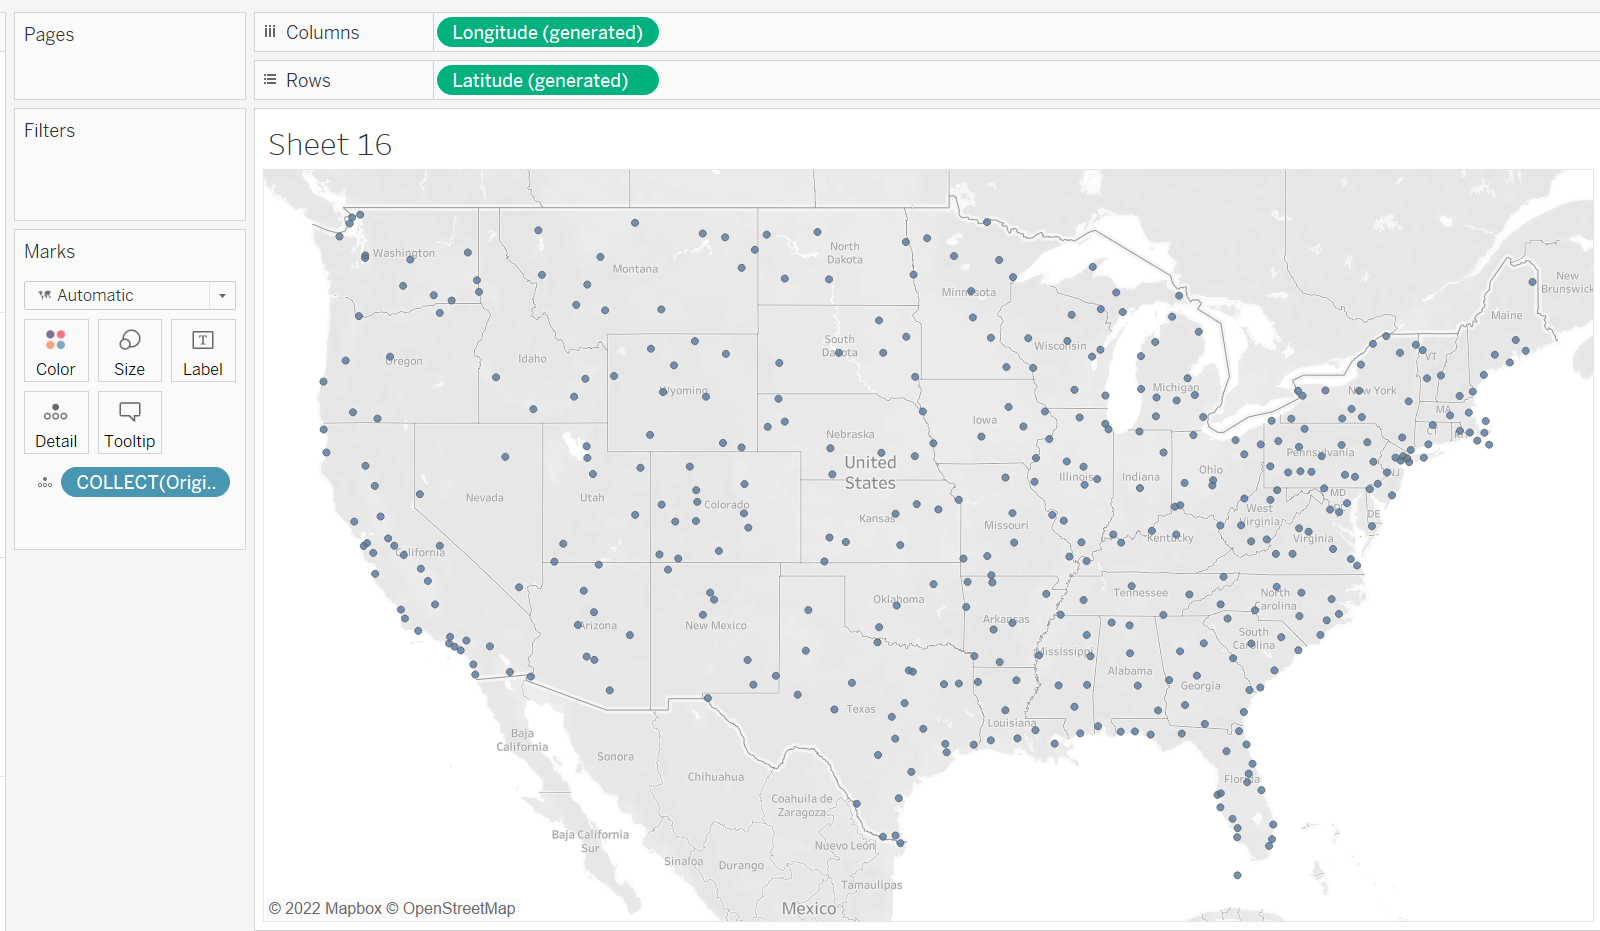
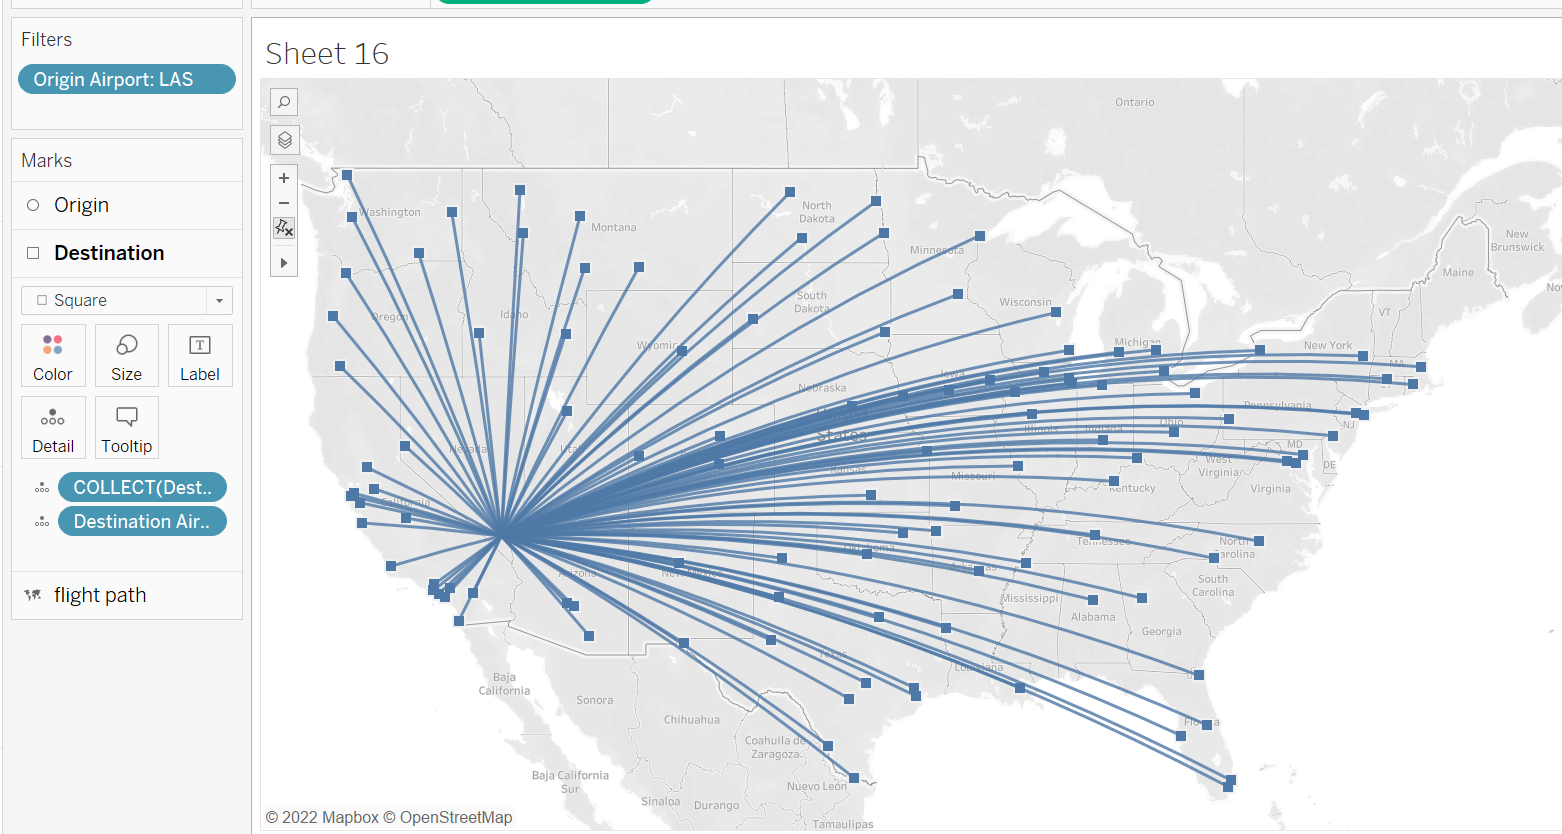
Now that our calculations are done we can start to create the map and for this we will be using layers. To do this lets start with Origin. Double click the origin field (the one we built on to create the markpoints) and the map below will appear.
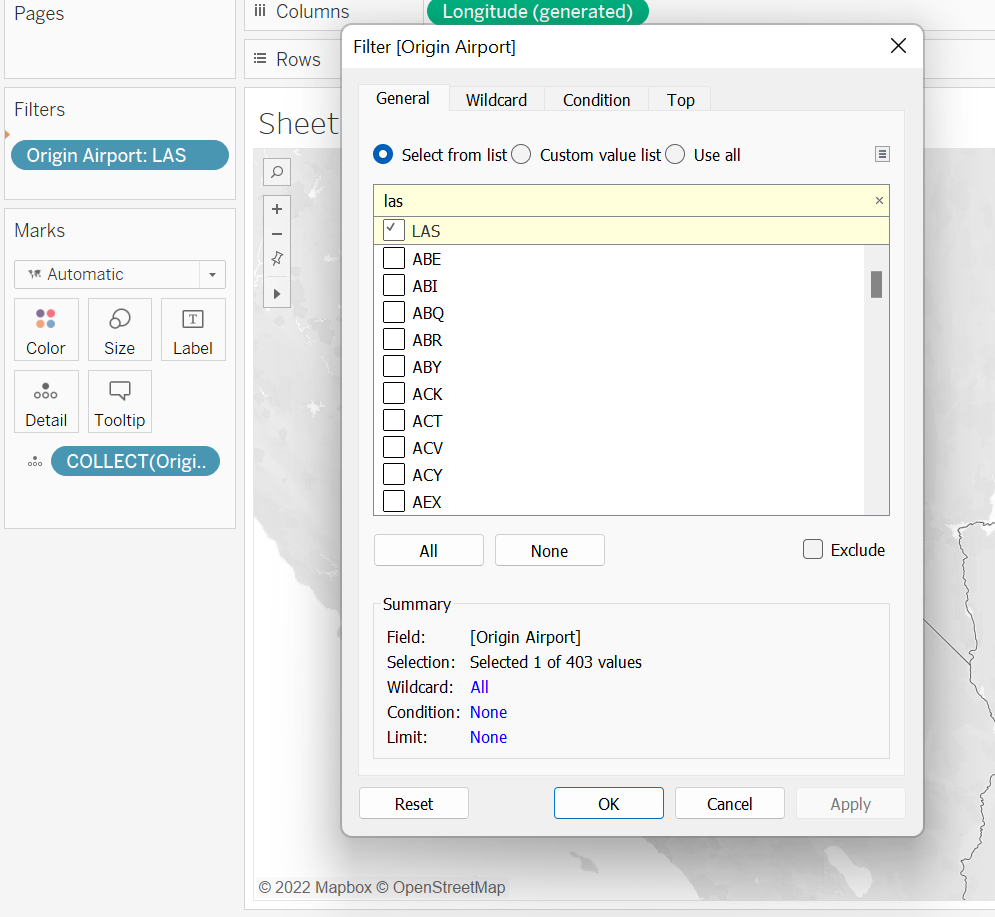
Now add to the filters section Origin Airport and click LAS.
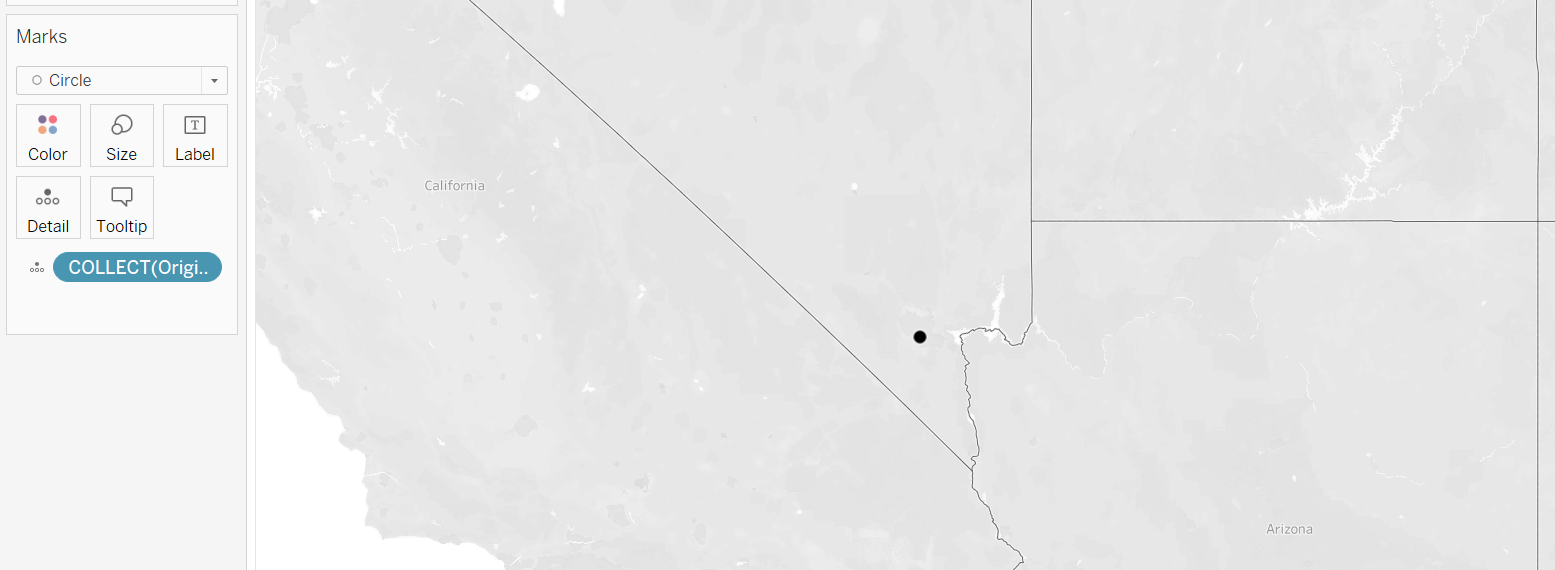
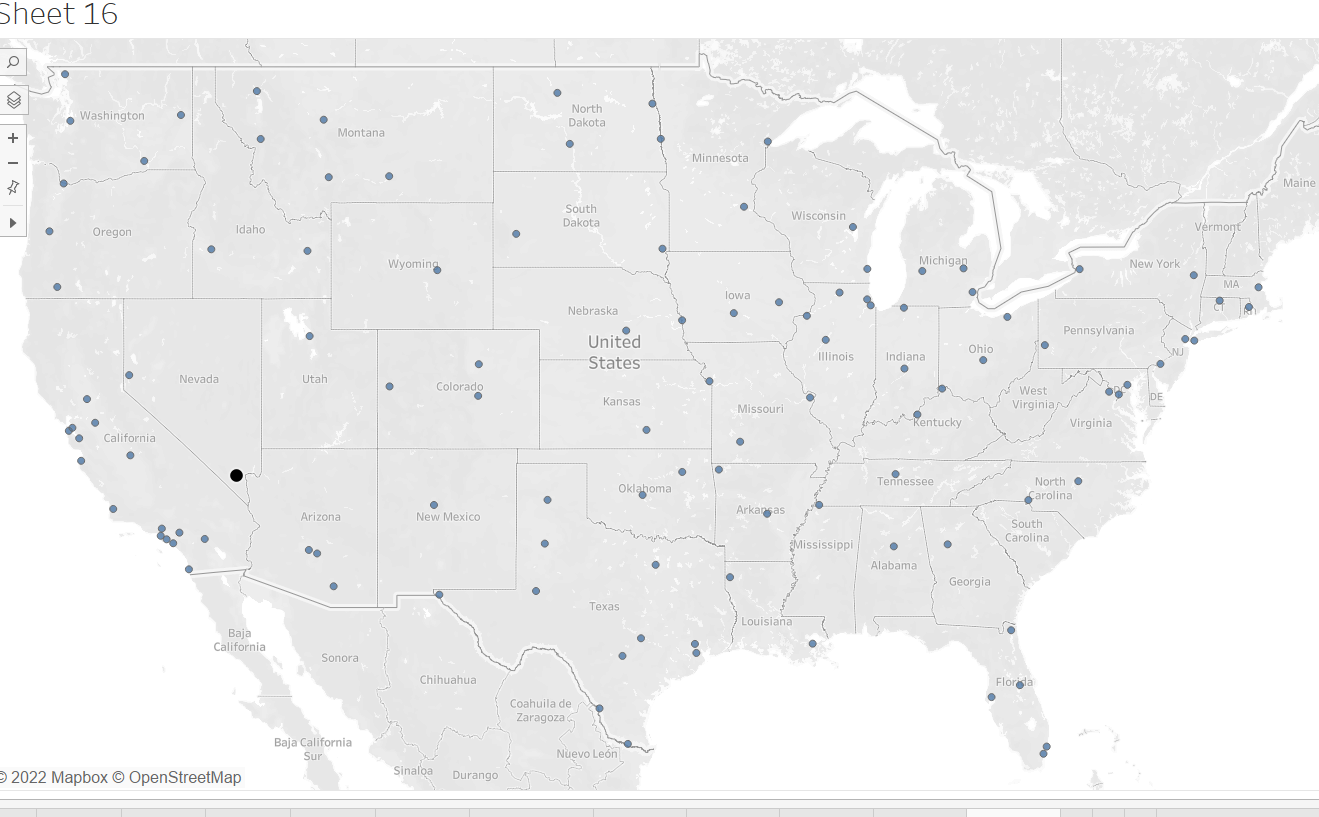
The next step is to change the mark to a circle and the colour to black. I made the size slightly bigger. Below shows the results.
For the next step we shall now add destination as a layer. To do this you need to grab destination ( once again using the markpoints for destination) and drag to canvas but this time there will be a marks layers if you place this on top of that you will see the following:
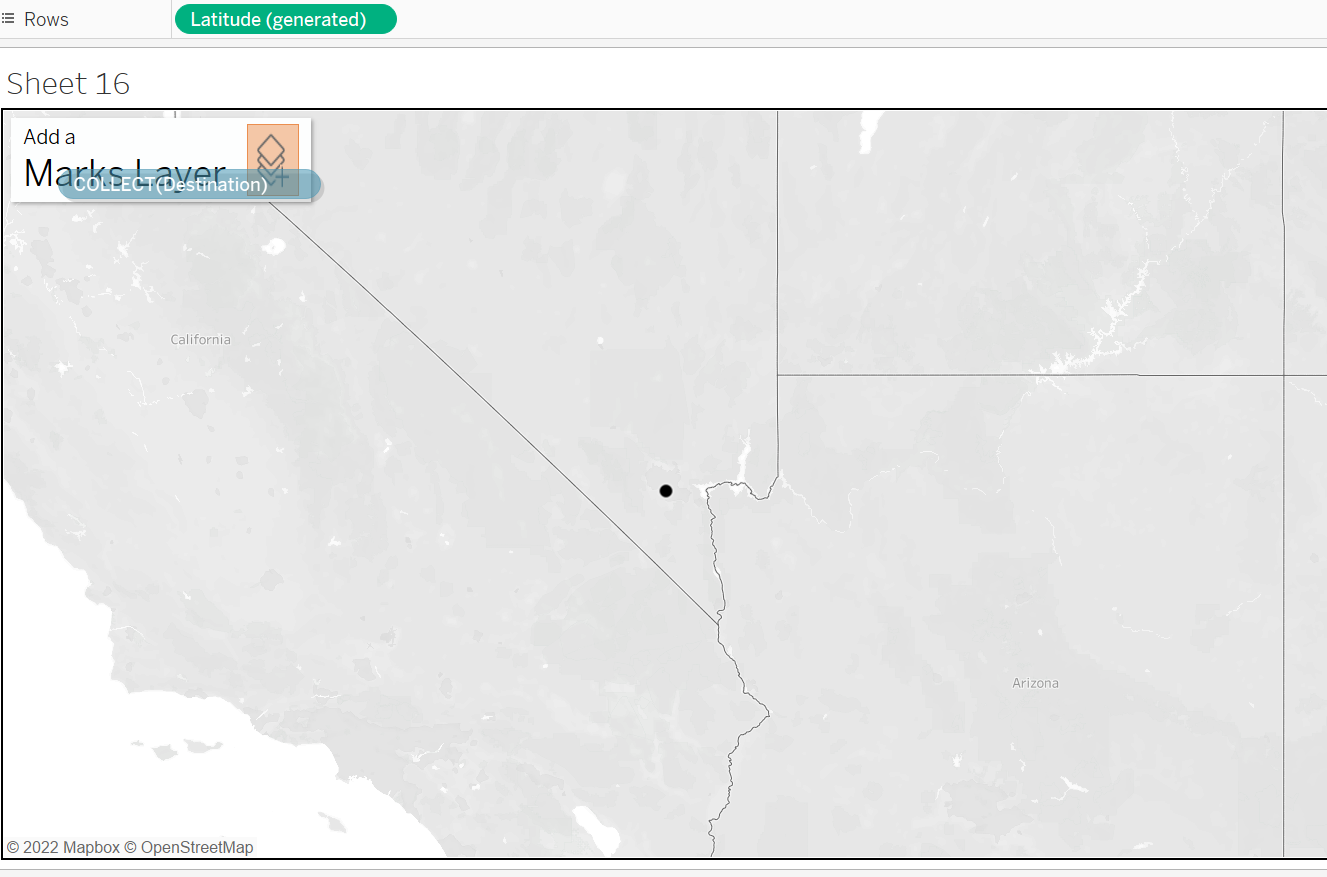
The next layer we want to add flight path so we can see the journey via a line on the map. So once again we drag this on marks layers.
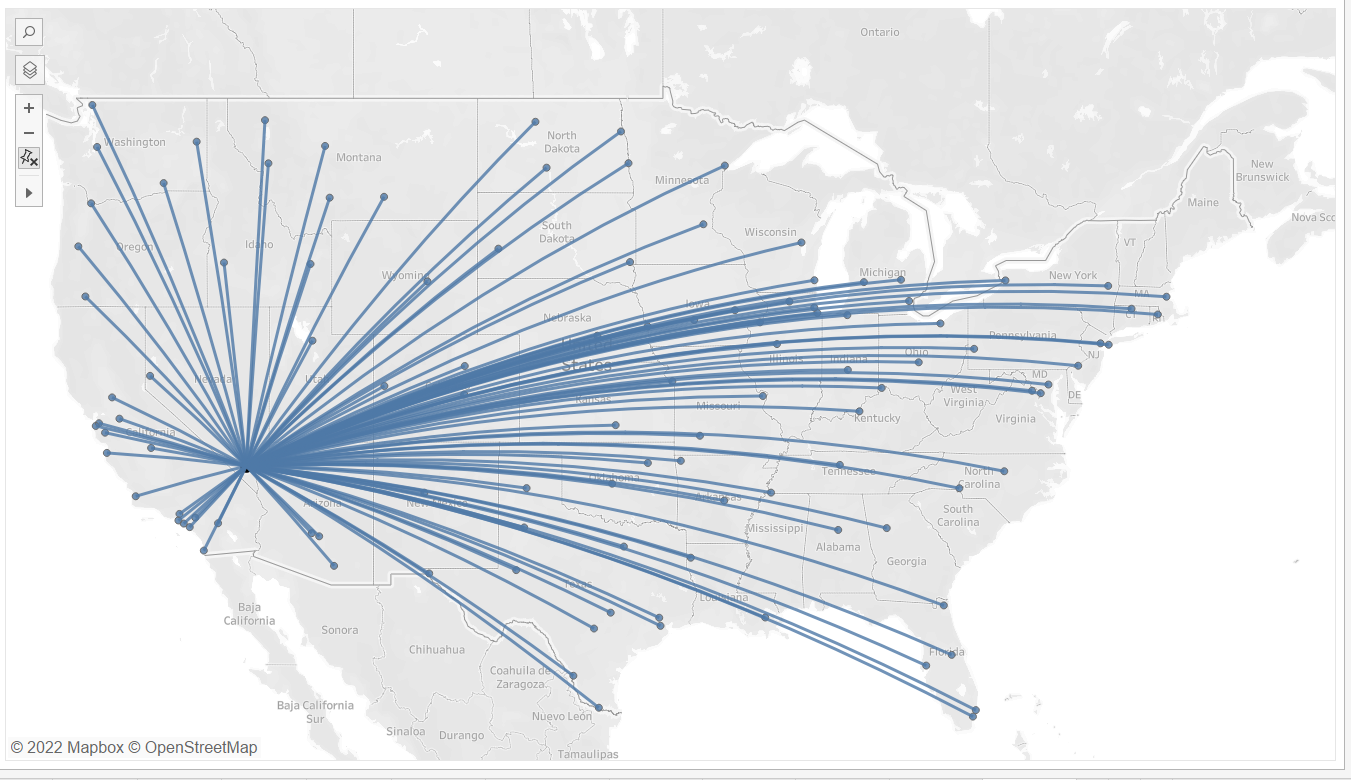
As we can see this overlaps all our other points. To do this all we need to do is reorder the marks.
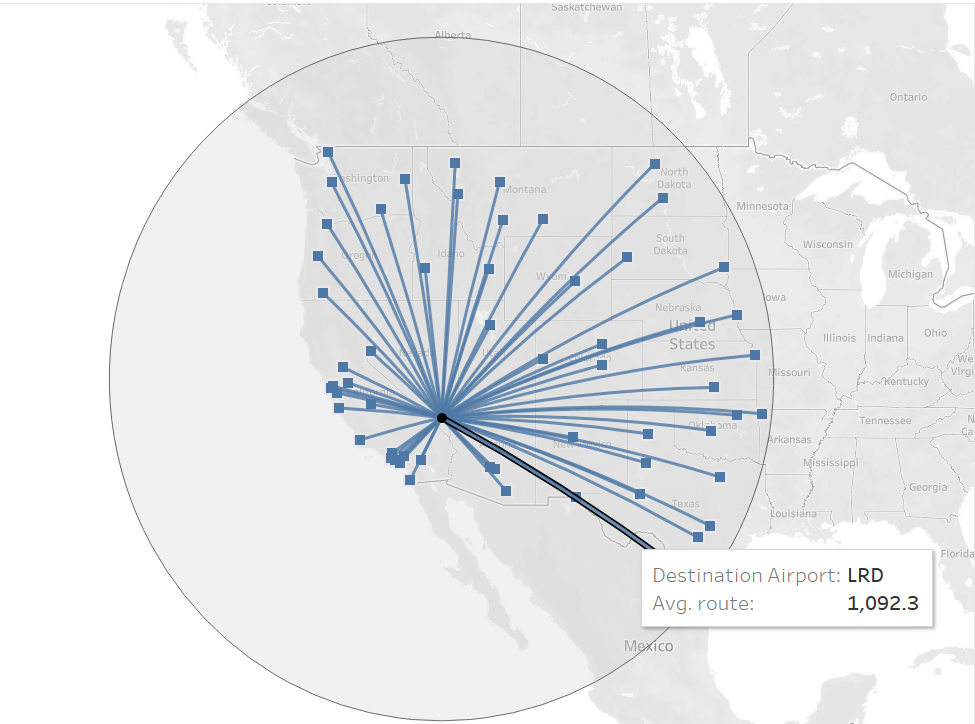
When hovering over the graph we can see that there is no distinct path.
To change this I added destination airport to detail to destination and flightpath. I also changed the mark type to square so it is more clear.
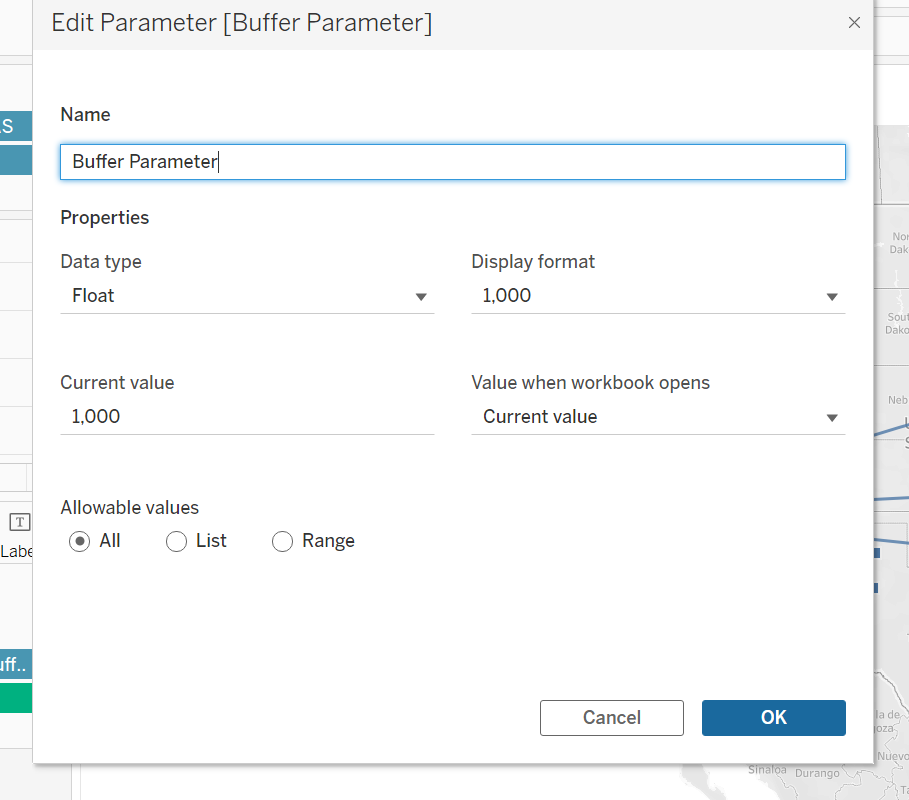
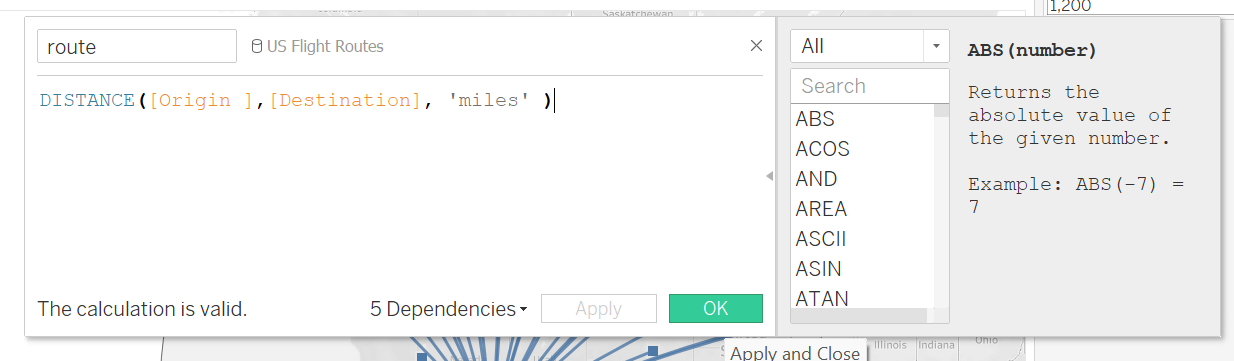
Its time to create a buffer. To do this I first created a parameter so our visual can be changed if we wanted to. Next I created a calculation called route so we could see how long each journey would take in miles.
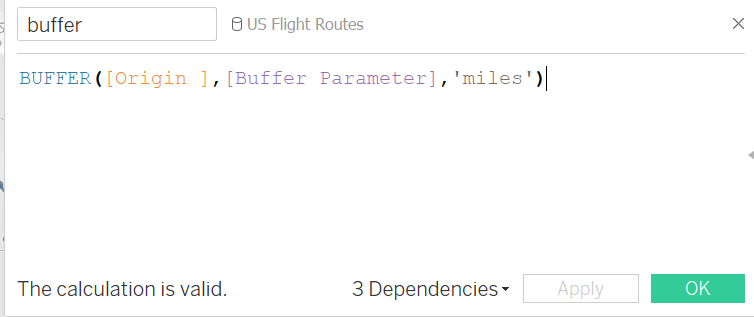
This calculation will allow to create a buffer. Now this is created we can add this to marks layers.
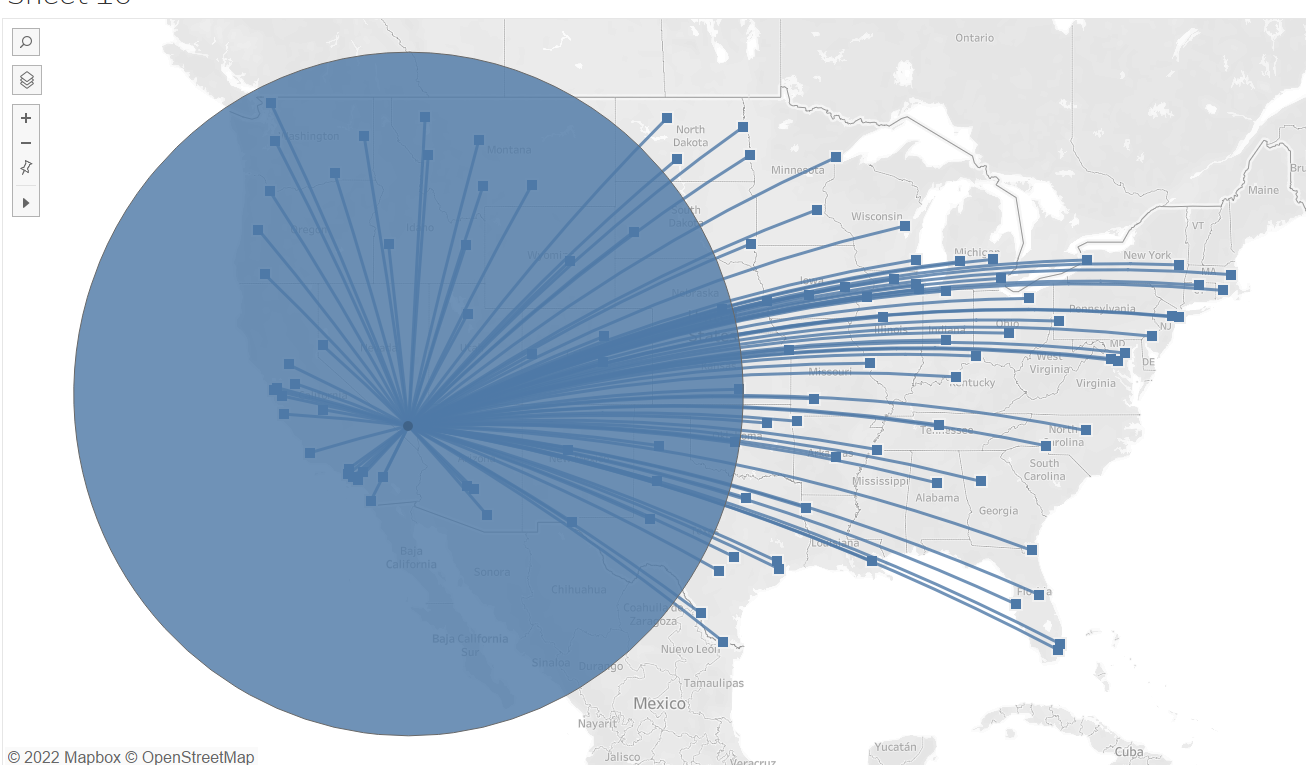
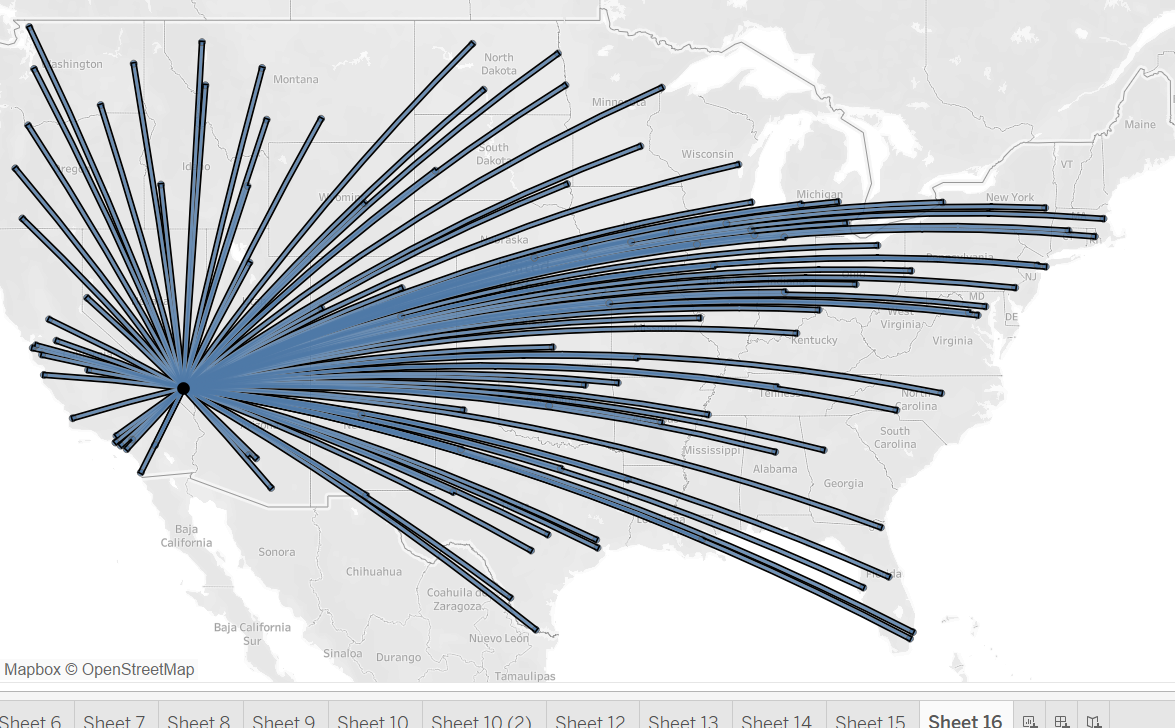
This is the outcome when we add the buffer. We need to now send this to the back and change the colour. I also lowered the opacity so that we can see the different locations behind the buffer. Doing this created the following results:
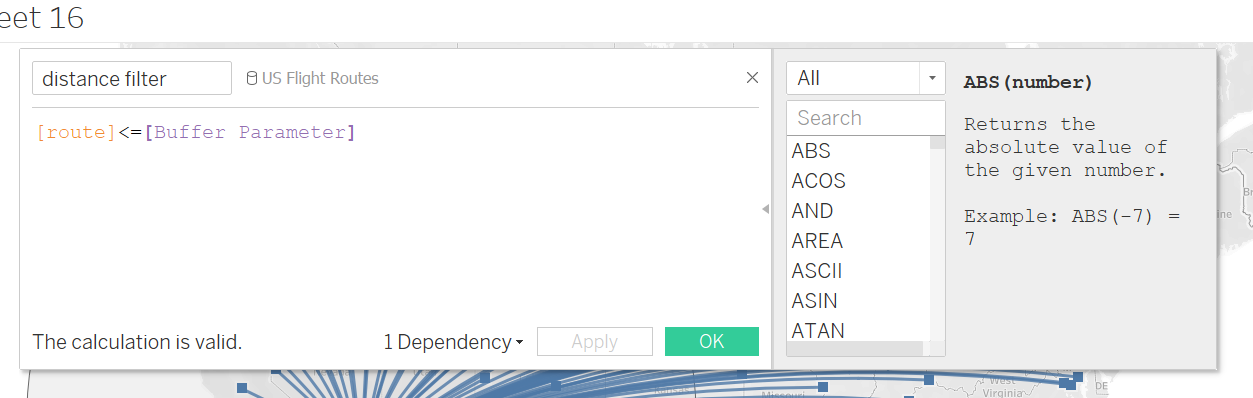
We can see we need to make the destinations fit within the buffer. To do this you need the following calculation. This will be followed by a further calculation which will create a Boolean.
This is the boolean calcualtion it is saying if route is smaller then buffer parameter then true if not false. We can add this to our filter section. We want this to be true so that all the routes from origin to destination fit in this buffer.
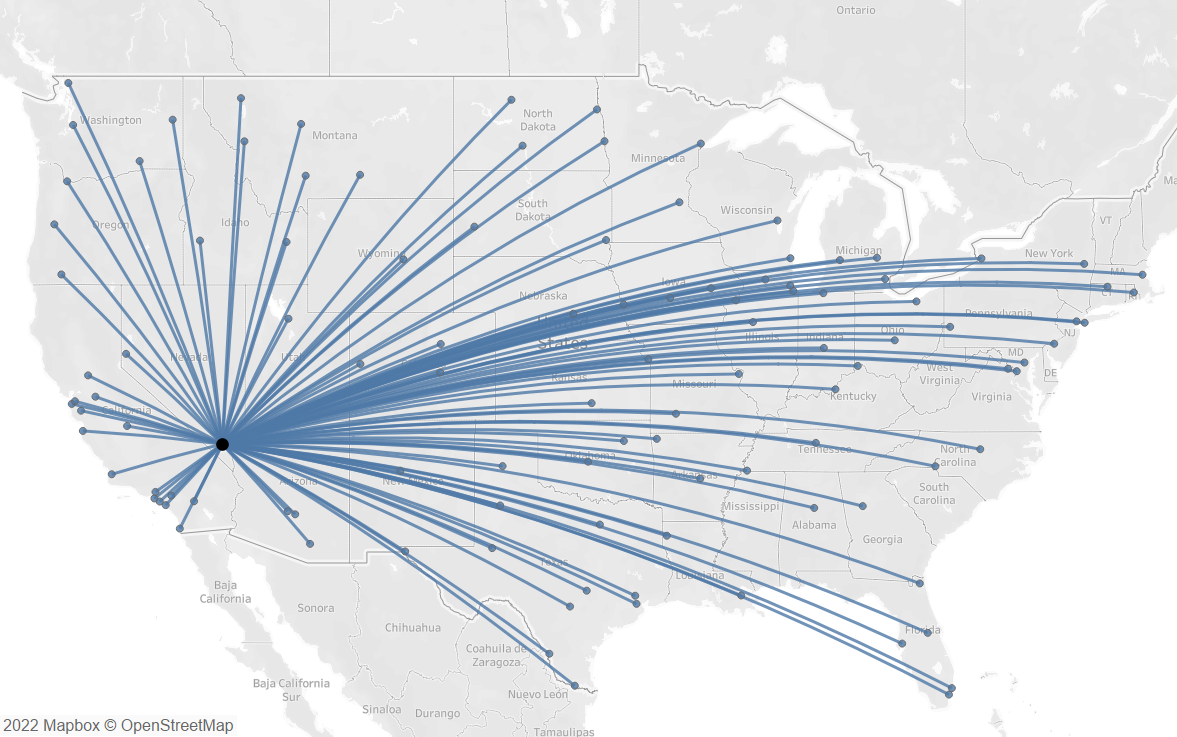
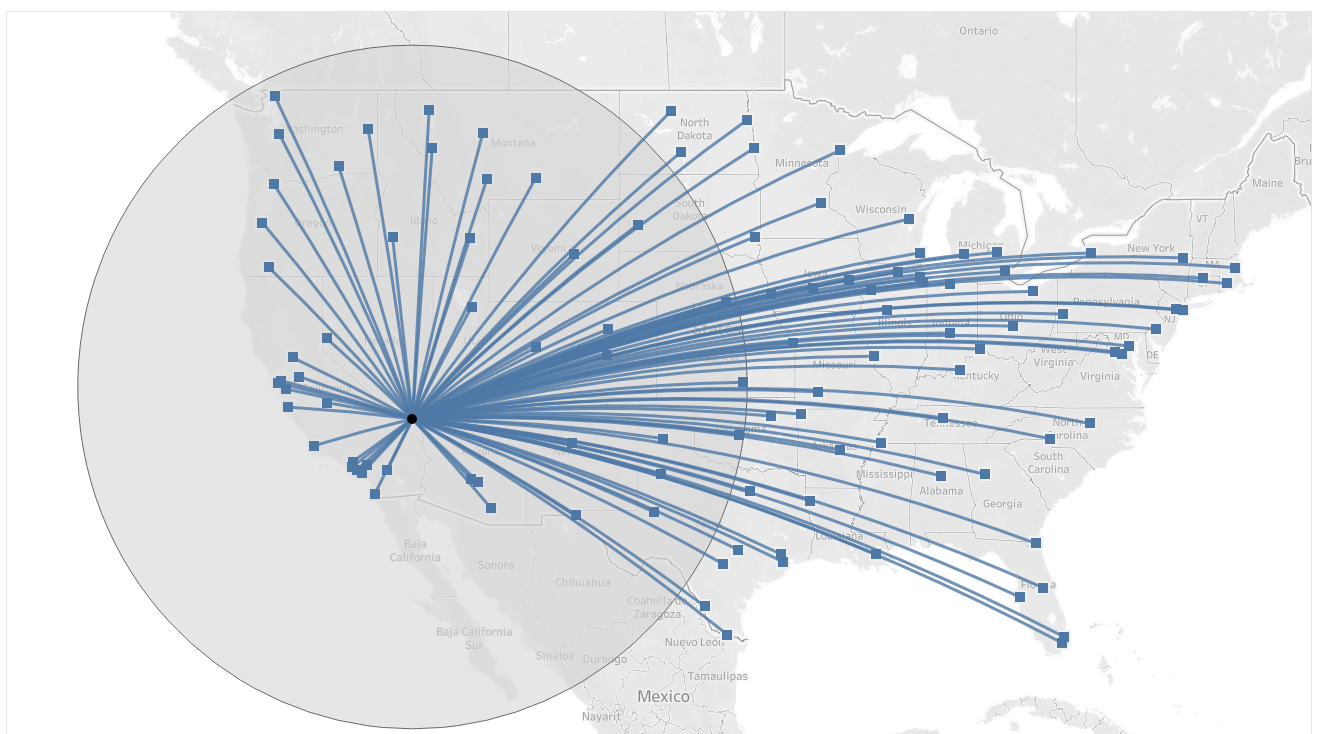
We get the final results below. The last step is to add it into a dashboard of 800x700px.