


So we made it to the final week of training and after 4 intense months it's nearly time for celebration... enter: Dashboard Week. A new project every single day for our final week! Starting the week strong with a webscraping project on 'The Perfect Summer Adventure'.
The Brief:
Scrape travel cost data from the Backpacker Index site to help travellers find the best-value summer destinations. You’ll collect both summary and detailed information from each city’s page and build a dashboard to support planning an unforgettable budget-friendly adventure. You should focus on a region as there’s a lot of data so you might want to narrow your scope given the time.
Source:
Price of Travel – Backpacker Index 2024
Deliverables:
- Scrape the main Backpacker Index page
- Scrape each city’s detail page
- Build your dashboard in a visualisation tool of your choice
- Blog and Presentation detailing:
- Your approach and process
- Challenges with scraping or cleaning
- Key findings and surprises
- Screenshot and link to your published dashboard
How did I do it?
Sketch and Planning
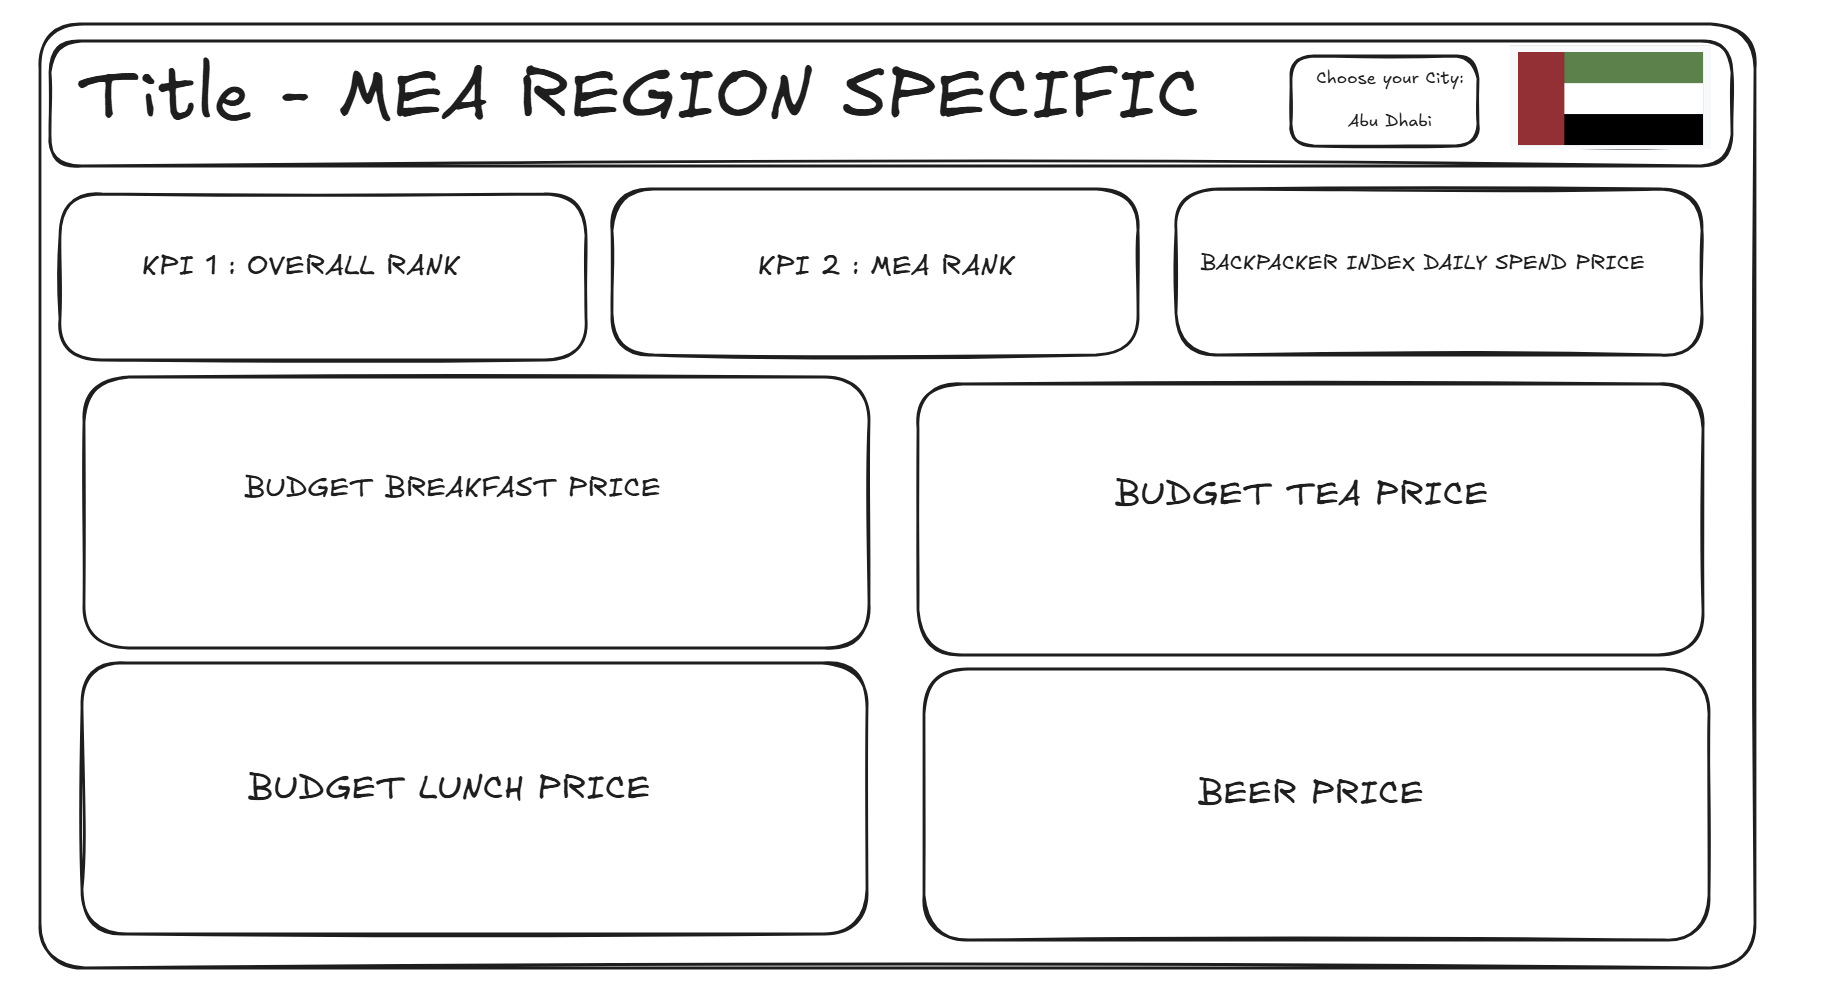
I chose the Middle East and Africa (MEA) region on the website and decided as a big food & drink fan, I want to focus on data based on countries in this area. After having a look over the data available on the website, I came up with the below sketch to highlight average food prices for breakfast, lunch and tea, as well as average beer price across a whole host of countries. I wanted there to be some sort of ranking aspect to it also, which would allow some direct comparison as other parts of the dashboard would be more exploratory - the idea that a user would go on and choose their holiday from a few different options, as opposed to being told where to go!
Alteryx Webscraping
Part 1. Webscrape main page
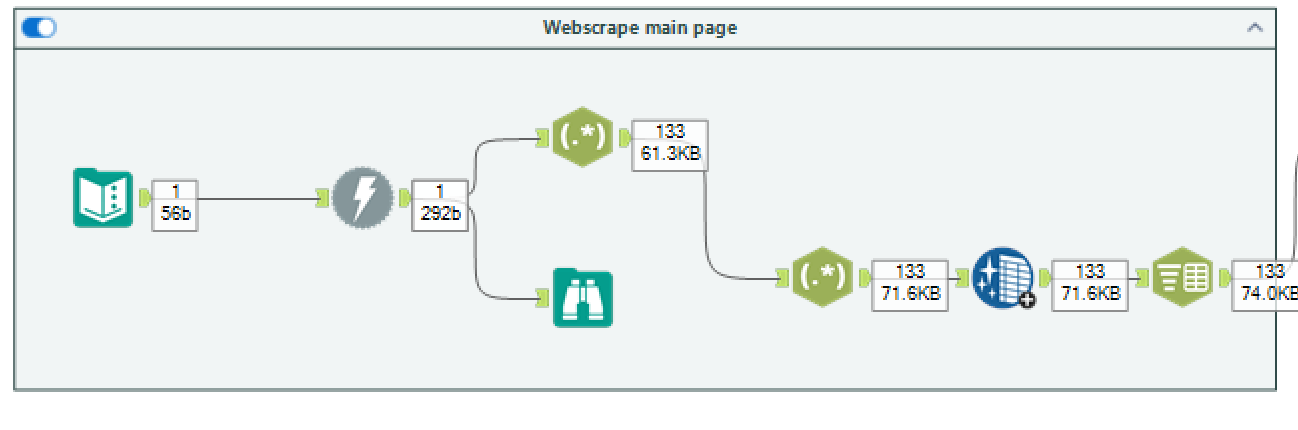
I started off by scraping the main website, as this contained ranking for all the available countries and had a general daily spending figure (Backpacker index), but also had URLs available for each individual cities page. The following workflow in alteryx was constructed (after a bit refresher on RegEx was needed!)
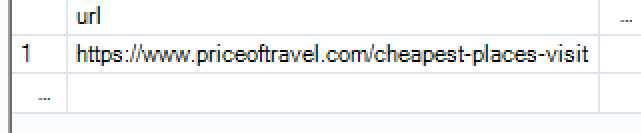
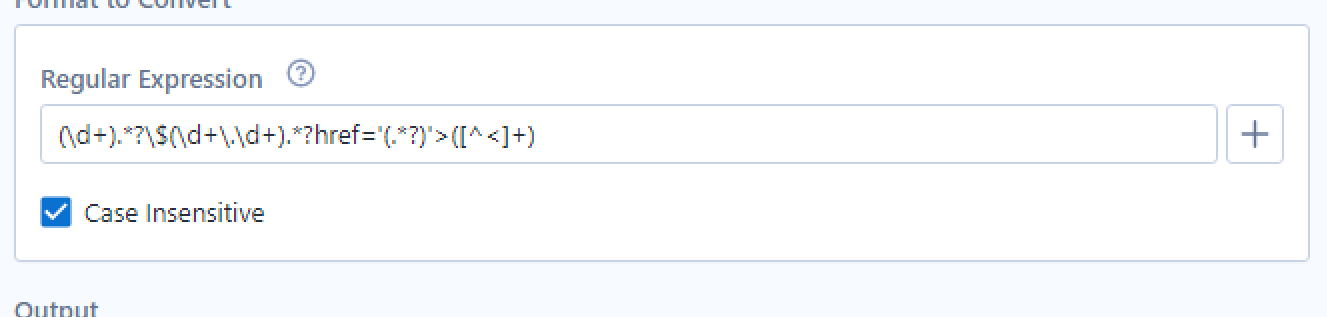
The URL and RegEx used:
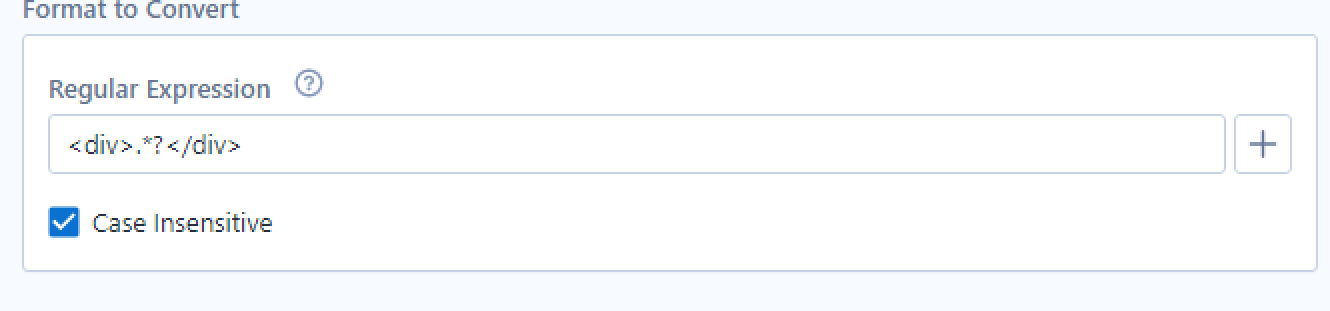
The above regex was used after the download tool, and was used to pull through the webpage essentially and then the below was used to pull through the whole world ranking with all the cities on.
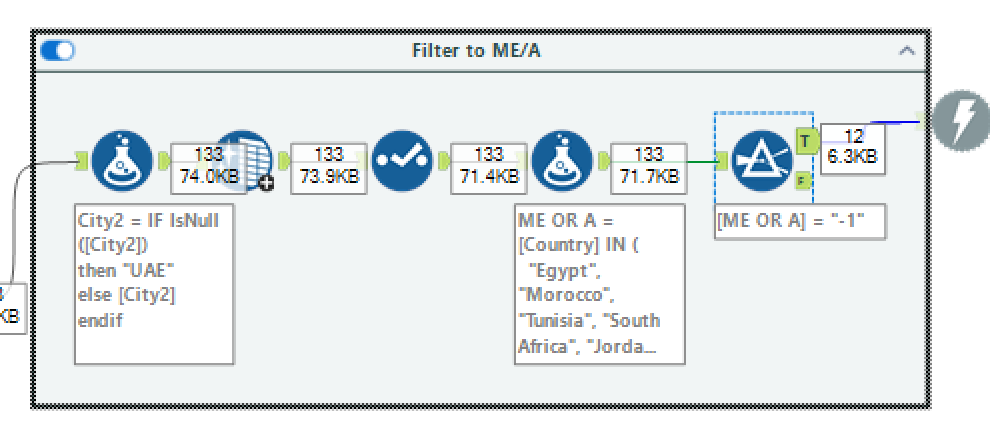
Part 2. Filter to MEA
Next I needed to filter to MEA region, so I could only pull through the relevant data around cities located here, avoiding exploding my data with European cities etc. However there was one problem, that the UAE wasn't coming up as a country, but rather null. So I used a formula to manually assign UAE to Dubai and Abu Dhabi and then I could filter out to the relevant countries.
Part 3. MEA city webscrape
Next was the fun part. Back to RegEx to pull through city data through the URLs we had for MEA cities. I managed to pull through the webpage data for individual cities with the following RegEx and then it was about splitting up the data as I pulled through the entire page for each city.
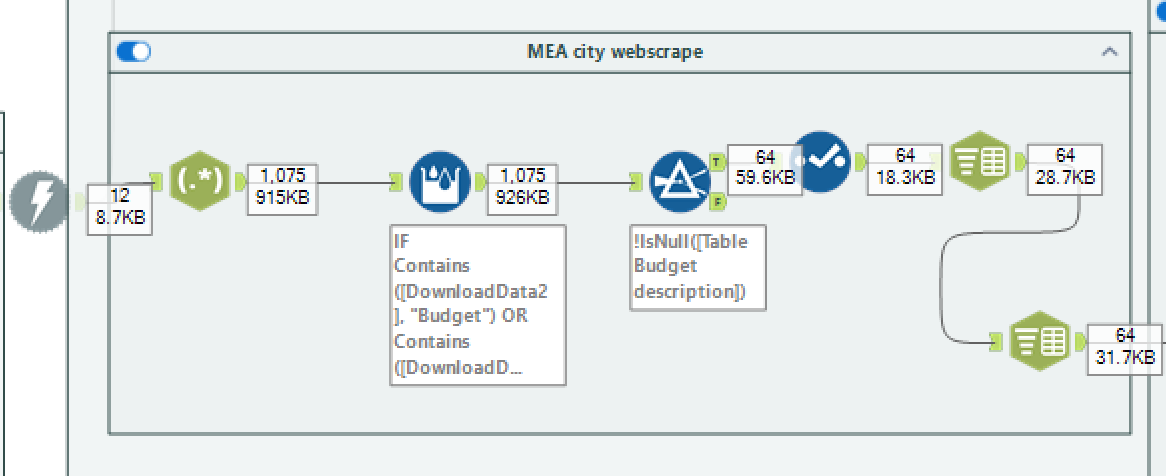
In the future it would've been good if I could've used RegEx to only pull through the food and drink table on each respective page but in the interest of time and me not going RegEx crazy, this was a good solution.
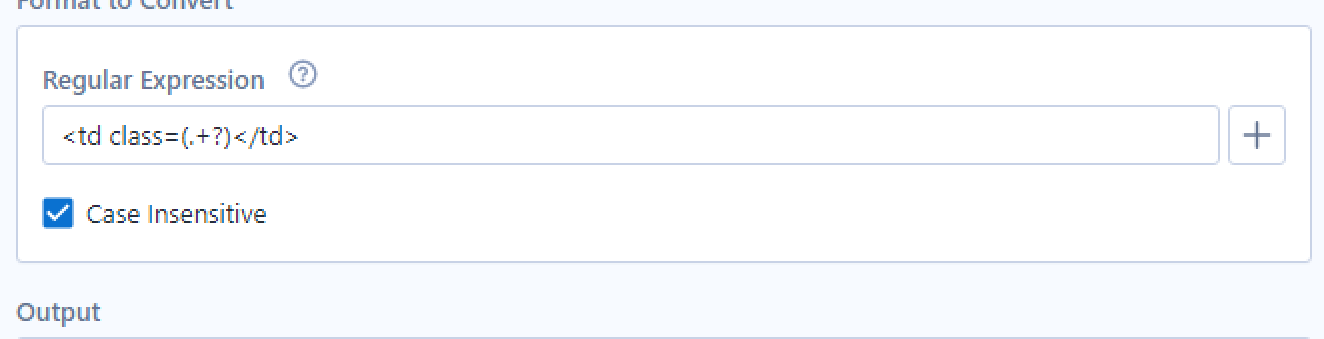
Part 4. MEA food & drink table
Finally, the last step was to isolate the food & drink data from the entire webpage which was a little manual and perhaps a slightly longer, more fiddly way of doing it - but considering we hadn't done RegEx since the day we first learnt it, I was fairly happy to find a working solution. See below for the workflow.
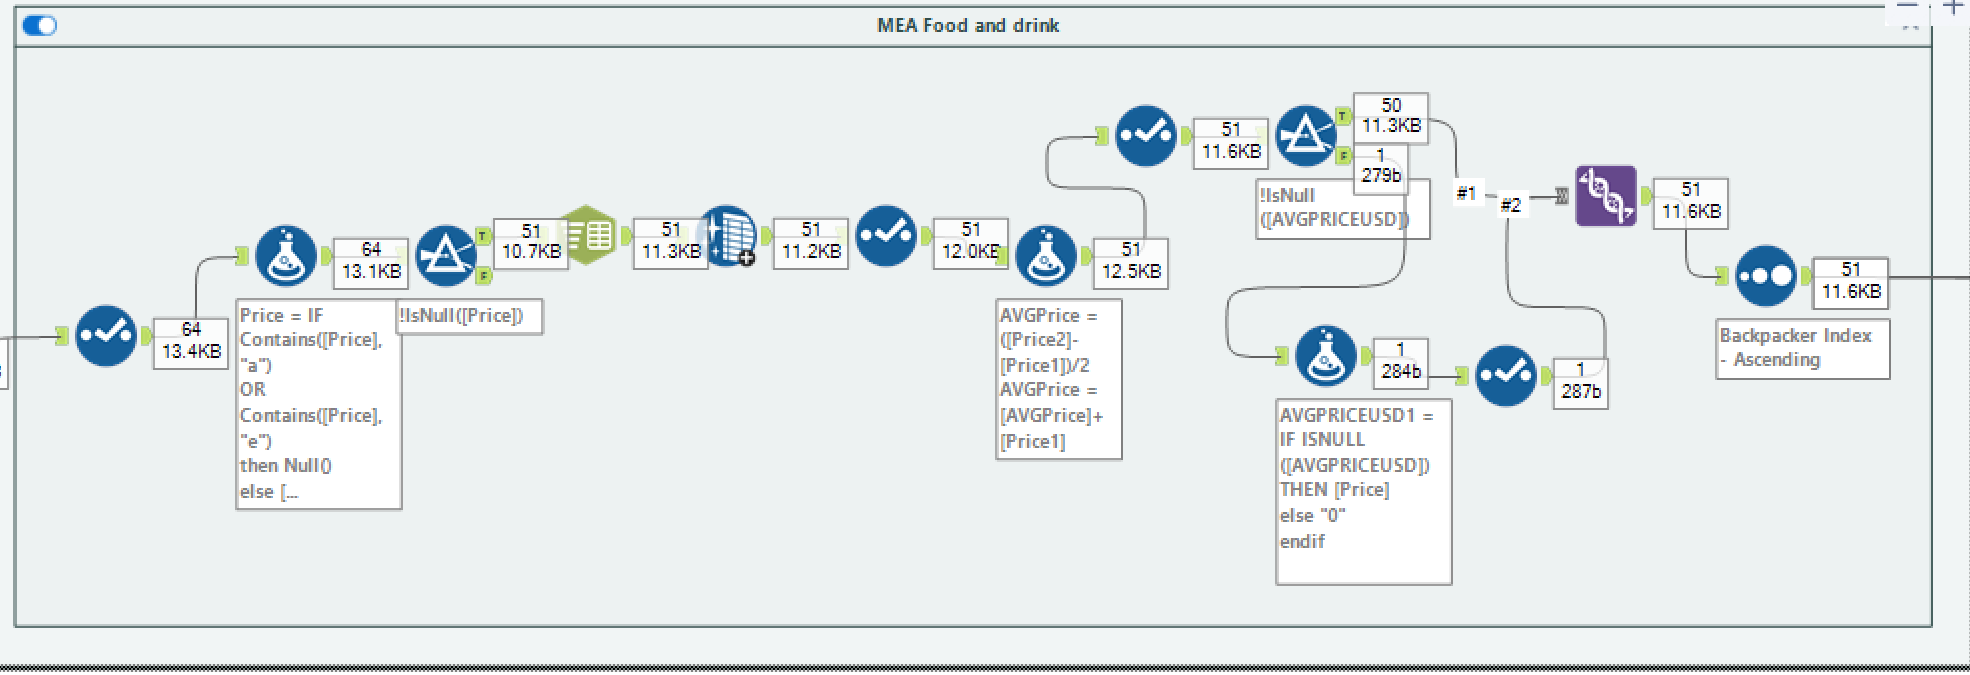
There were a few small problems thrown up by I managed to work around them and ultimately output the file as a .csv in anticipation for visualising in PowerBI.
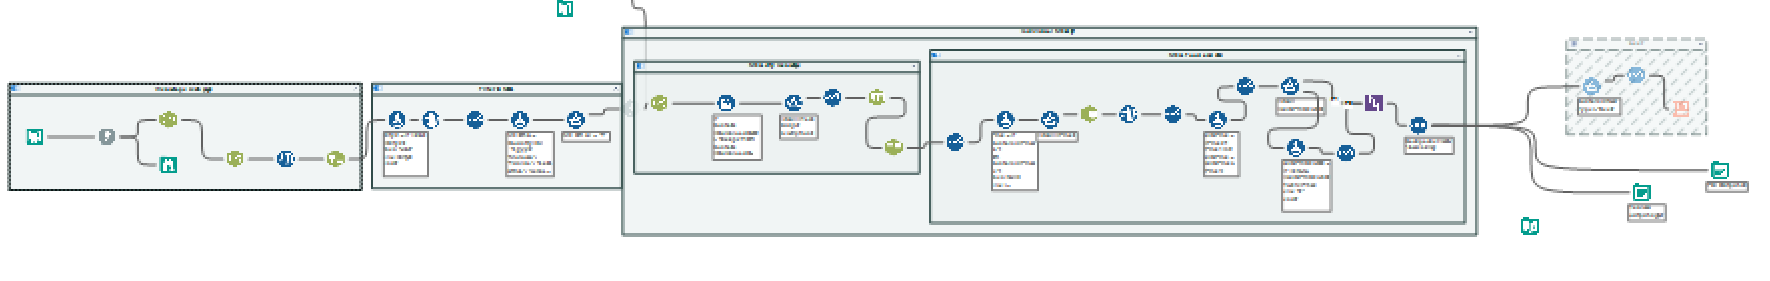
Part 5. Full workflow
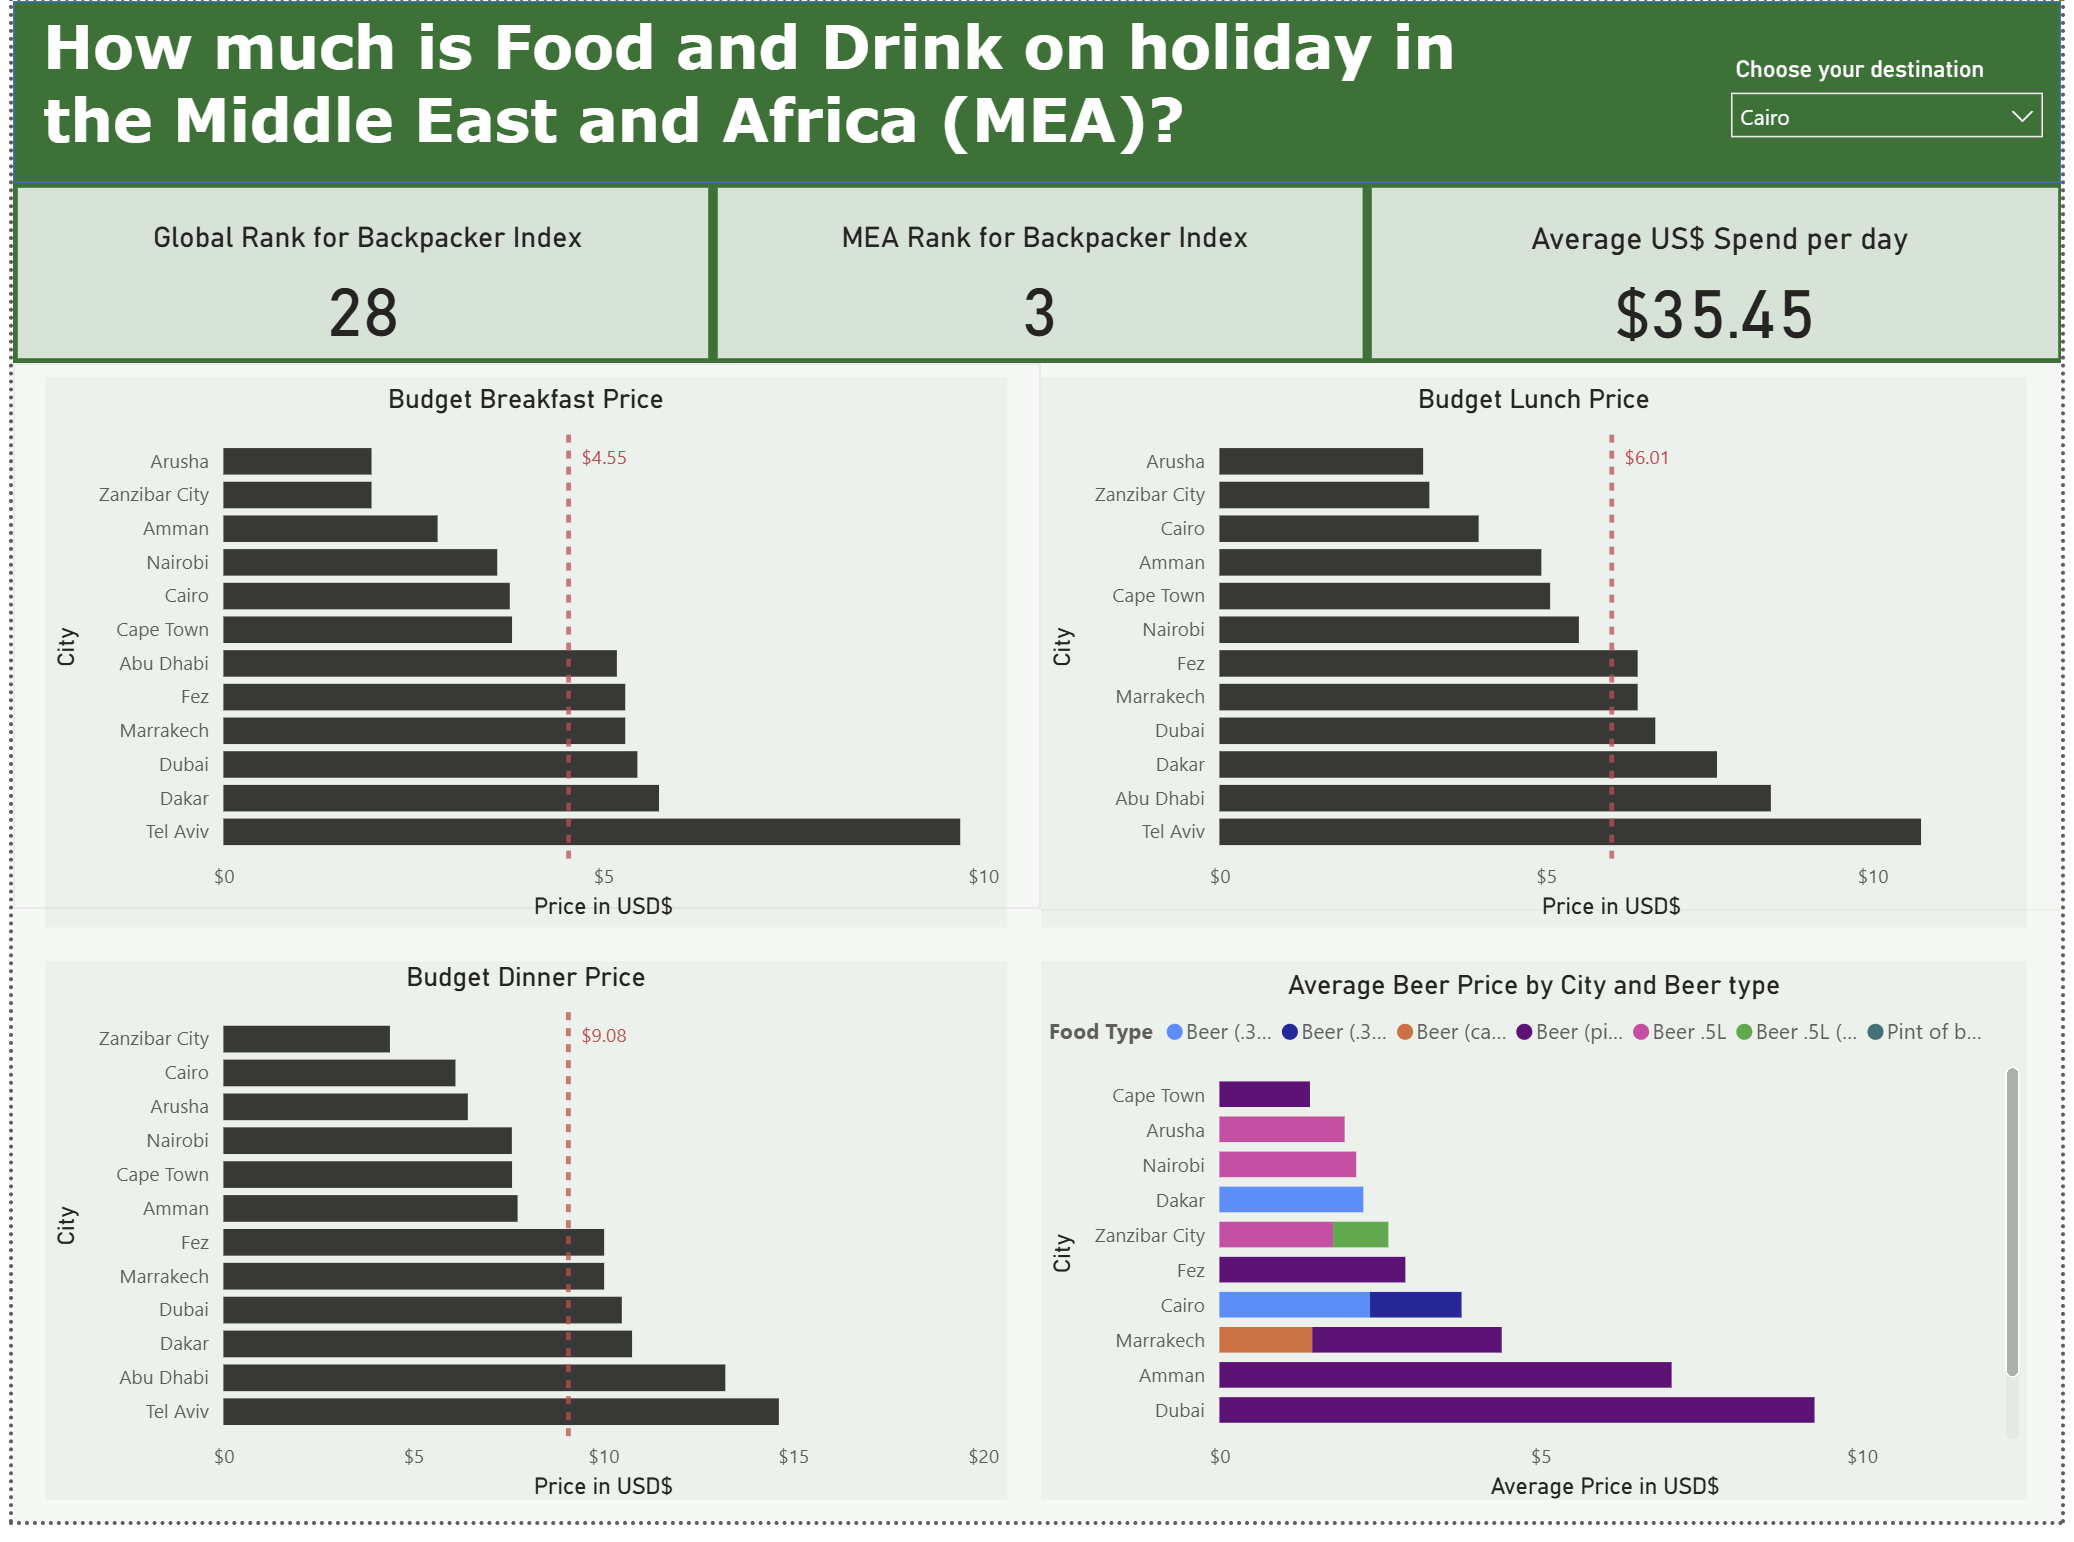
PowerBI visualisation
Once I had output and had the data in a format I wanted and most of the calculations already done - it was just about building on my sketch and formatting, which I managed to get done relatively quickly due to the long work spent in alteryx. See below for my dashboard image and a link.

Reflections & Challenges
- Actual webcraping and the concept of it was pretty fine and a nice refresher...
- Using RegEx again, not so much...but good practice and I definitely feel like I've learnt something and improved my skills so that's a big win
- May have descoped my dashboard a little bit too much and could've provided extra info for better analysis as I only had 12 countries in the region, so could've done food & drink and maybe weather analysis for example.
- Good to get back on PowerBI and starting to feel pretty sharp on it, despite ever-switching between Tableau!
- Presentation went well which I managed to have a quick run through and make a slide deck before presenting which was nice. See below for presentation.
Review
All in all a good day where I've definitely come away and improved my skills and knowledge! Hopefully I'll get the chance to do some more RegEx at some point as that's definitely an area where I'm lacking. Onto day 2...