


After doing two days of focussing fully on Tableau, the third day of dashboard week included a huge section of data preparation on Alteryx. The task was to webscrape data from cheese.com and take out names of cheese's based on three beginning letters that were given to you. I was given the letters P, Q and R so I had to scrape cheese names and their descriptions from cheese's that began with P, Q and R.
However, once that was done, we had to compile all our data into one big dataset to build a dashboard. I decided to scrape all the data from the website and compile a full dataset.
The challenges I faced were based on getting the data as web-scraping can be very difficult especially given the fact that pagination was involved. I was able to use a batch macro to do that though despite some difficulties replacing the string value with the control parameter. The regex portion of the workflow was also difficult to grasp initially but as I progressed with the workflow, it was easier to parse out data. Below is the final result of the workflow:
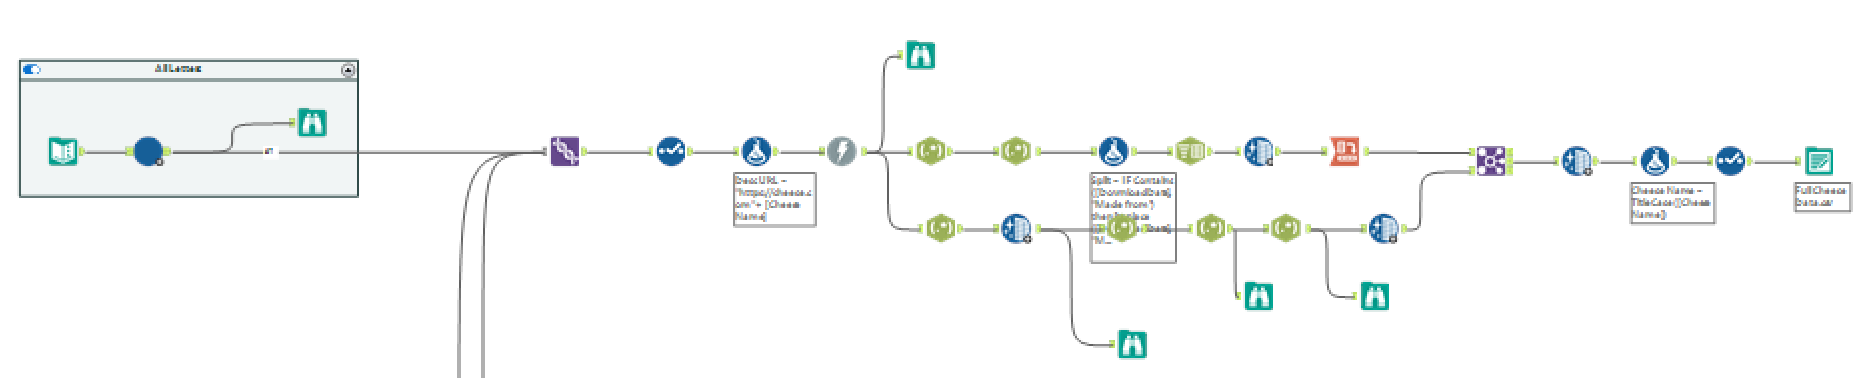
(Note: A union was used originally as I was unioning data from cheese names beginning with P, Q and R but this was not required anymore.)
Once the data prep was complete, it was time to build a dashboard, which looked like this:
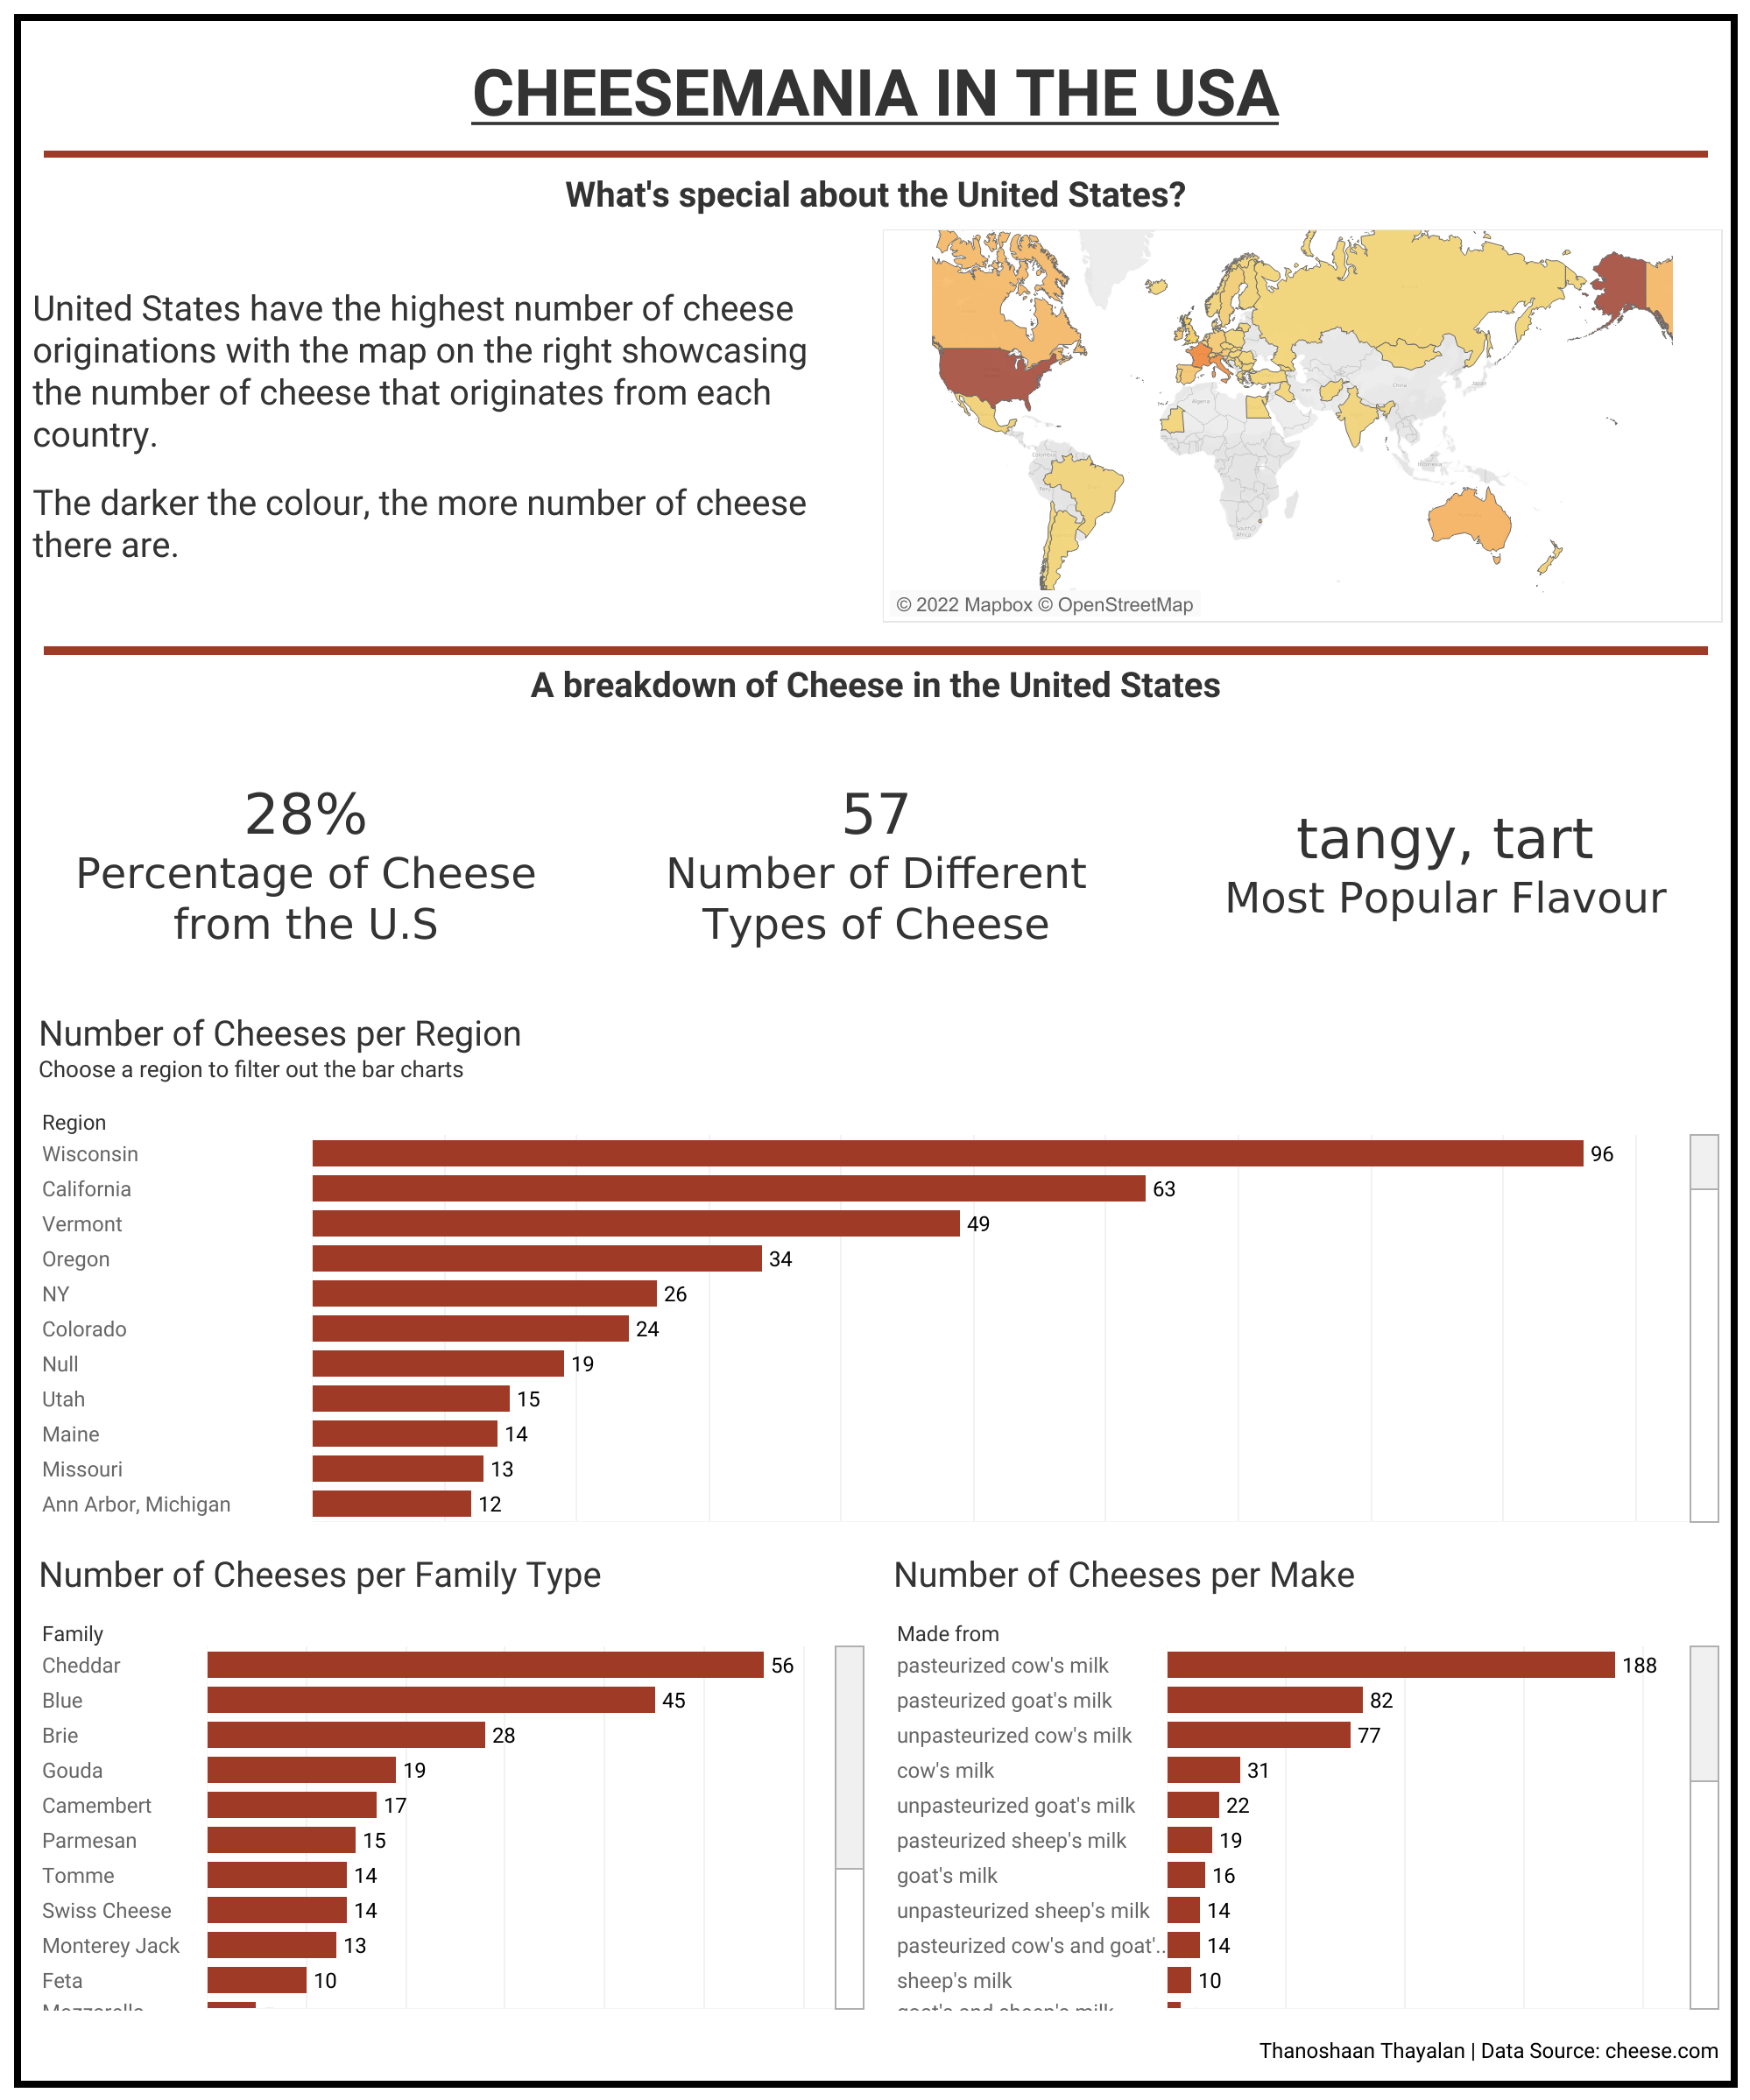
You can find the dashboard here: https://public.tableau.com/views/CheesemaniaintheUSA/CheeseinUS?:language=en-US&publish=yes&:display_count=n&:origin=viz_share_link