


In our final day of training at The Data School, we had one final task, which was to create a dashboard using finance data using some requirements that had been set.
We had to create calculations to try and have some insight but the main issue that we encountered was that the data they expected us to layout in the visualisation was not the one that we were given. With the scope being to give an overview of the important statistics, as well as provide a deeper breakdown of an income and balance sheet, it wasn't possible to provide a deeper breakdown of those two sheets. As a compromise, I decided to produce a mock dashboard as a navigation button to showcase an idea of what I wanted to do.
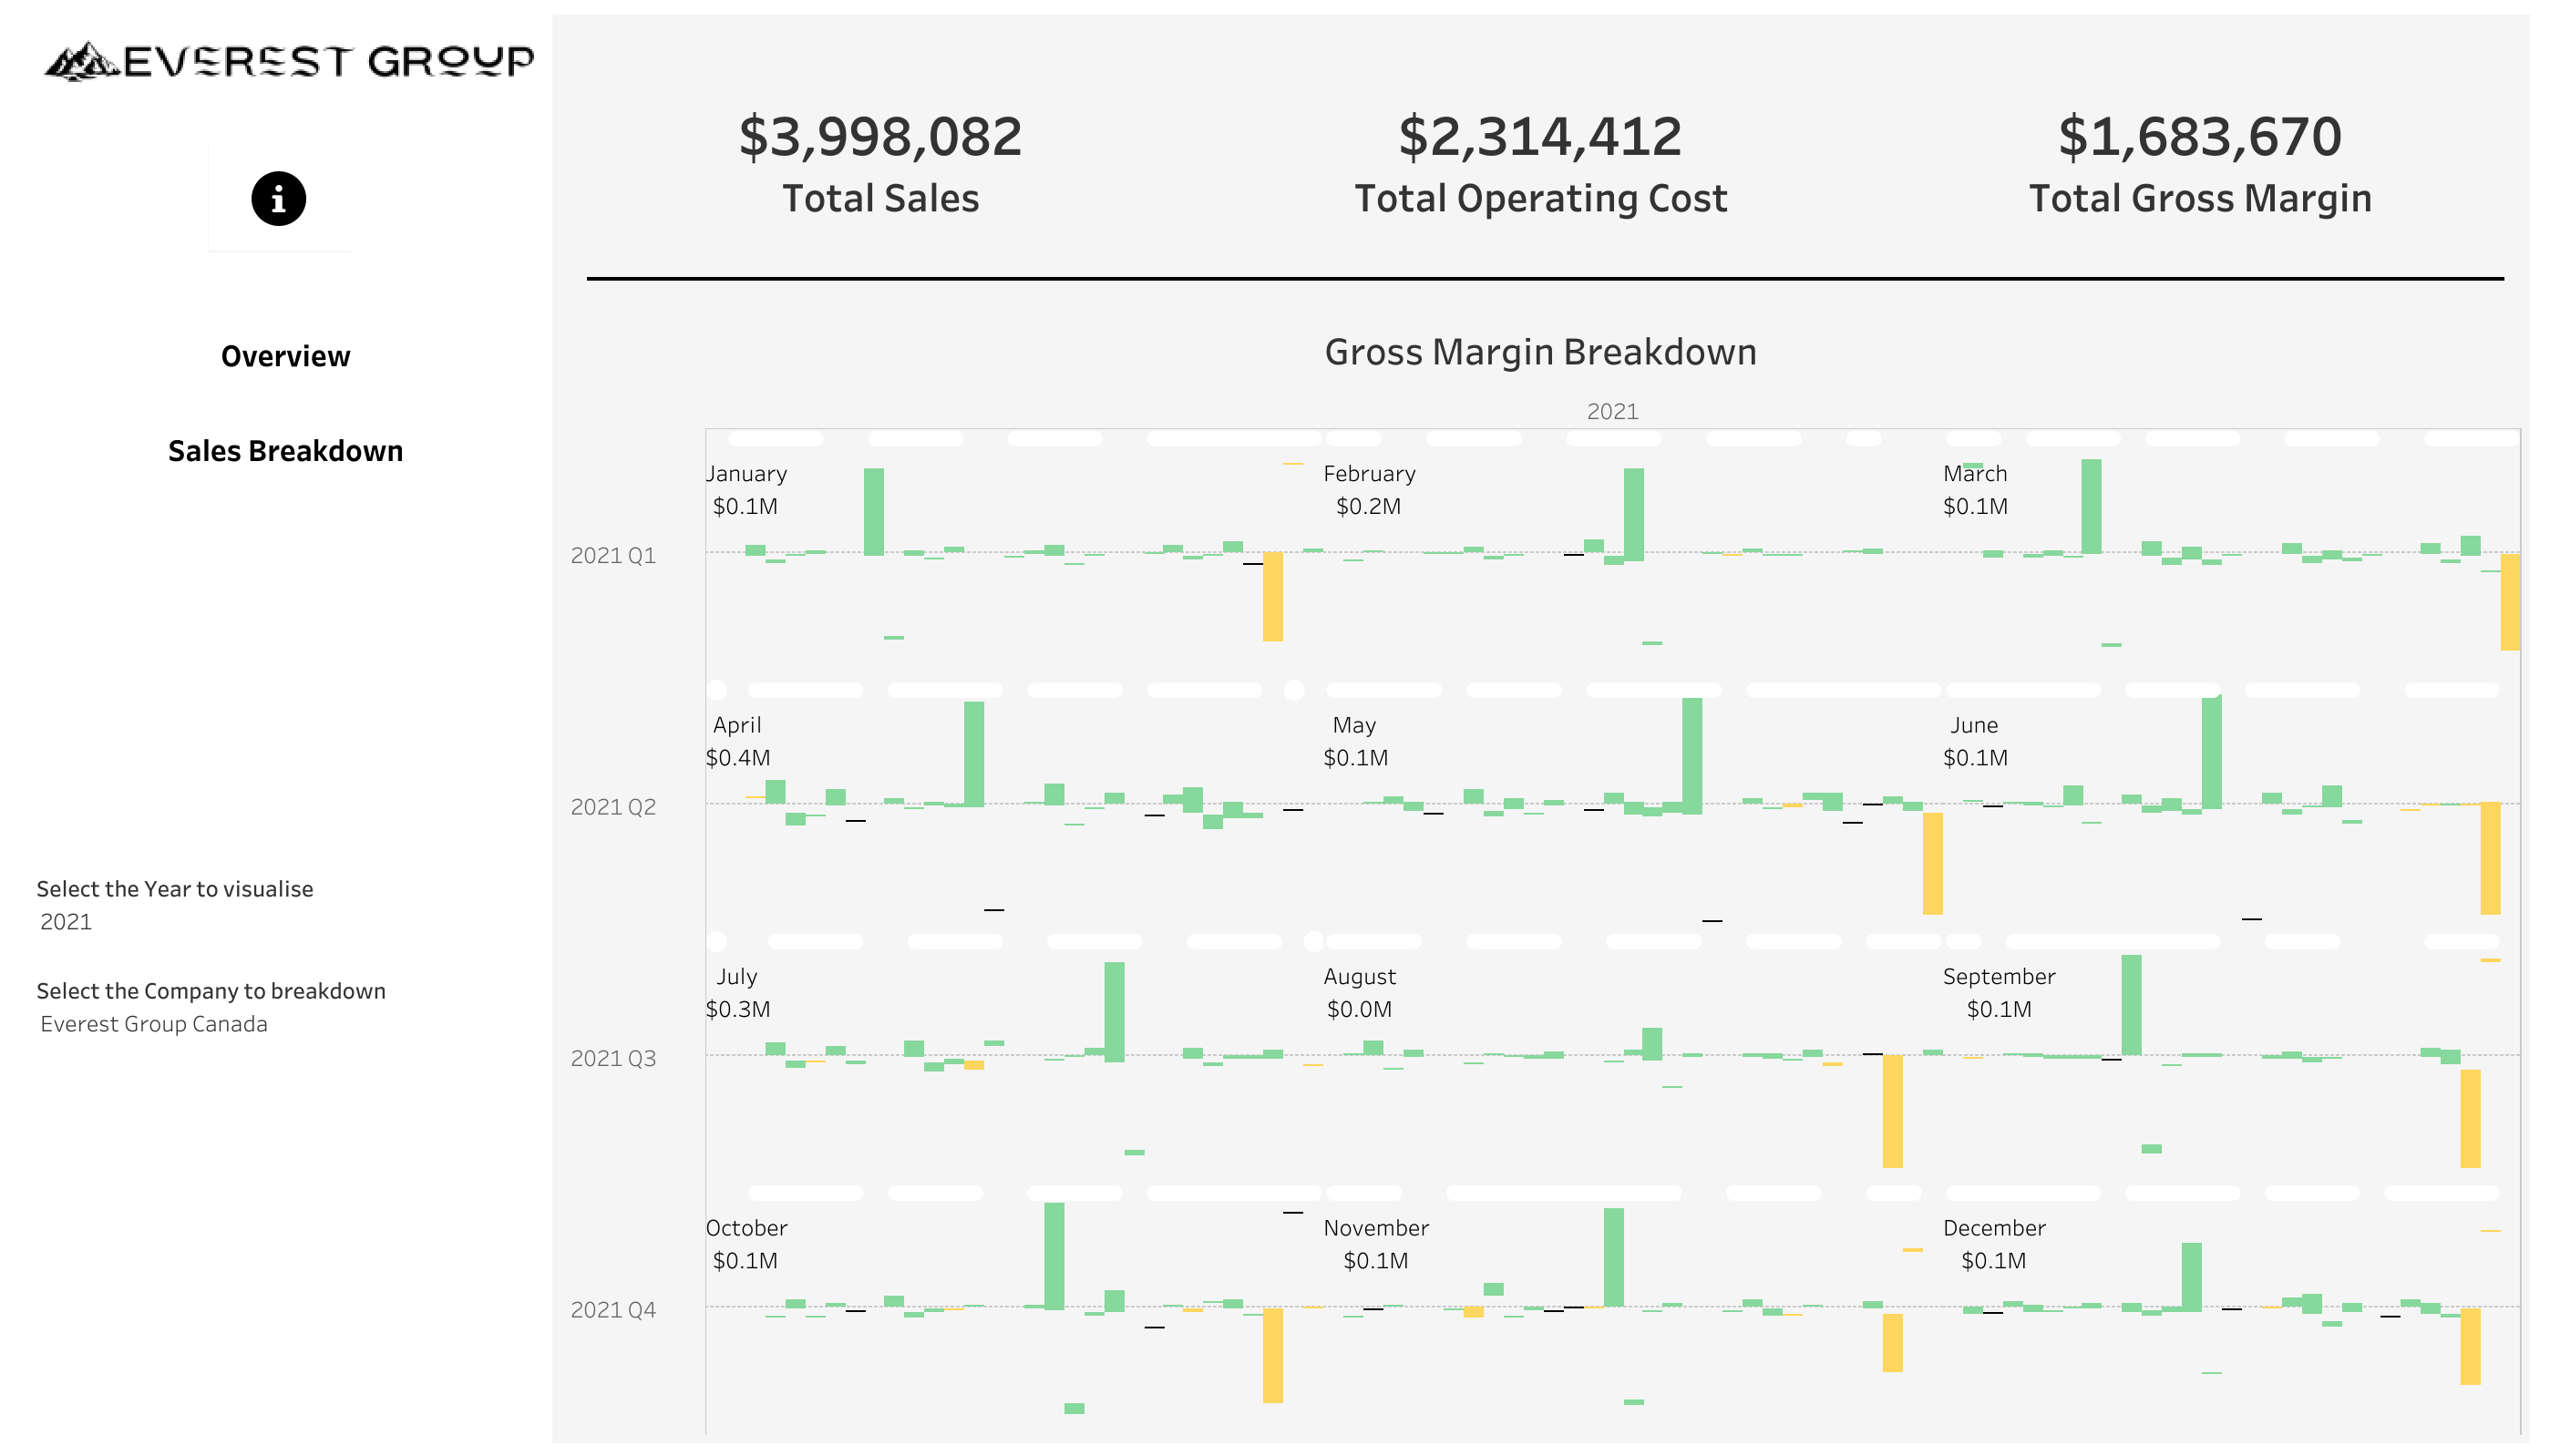
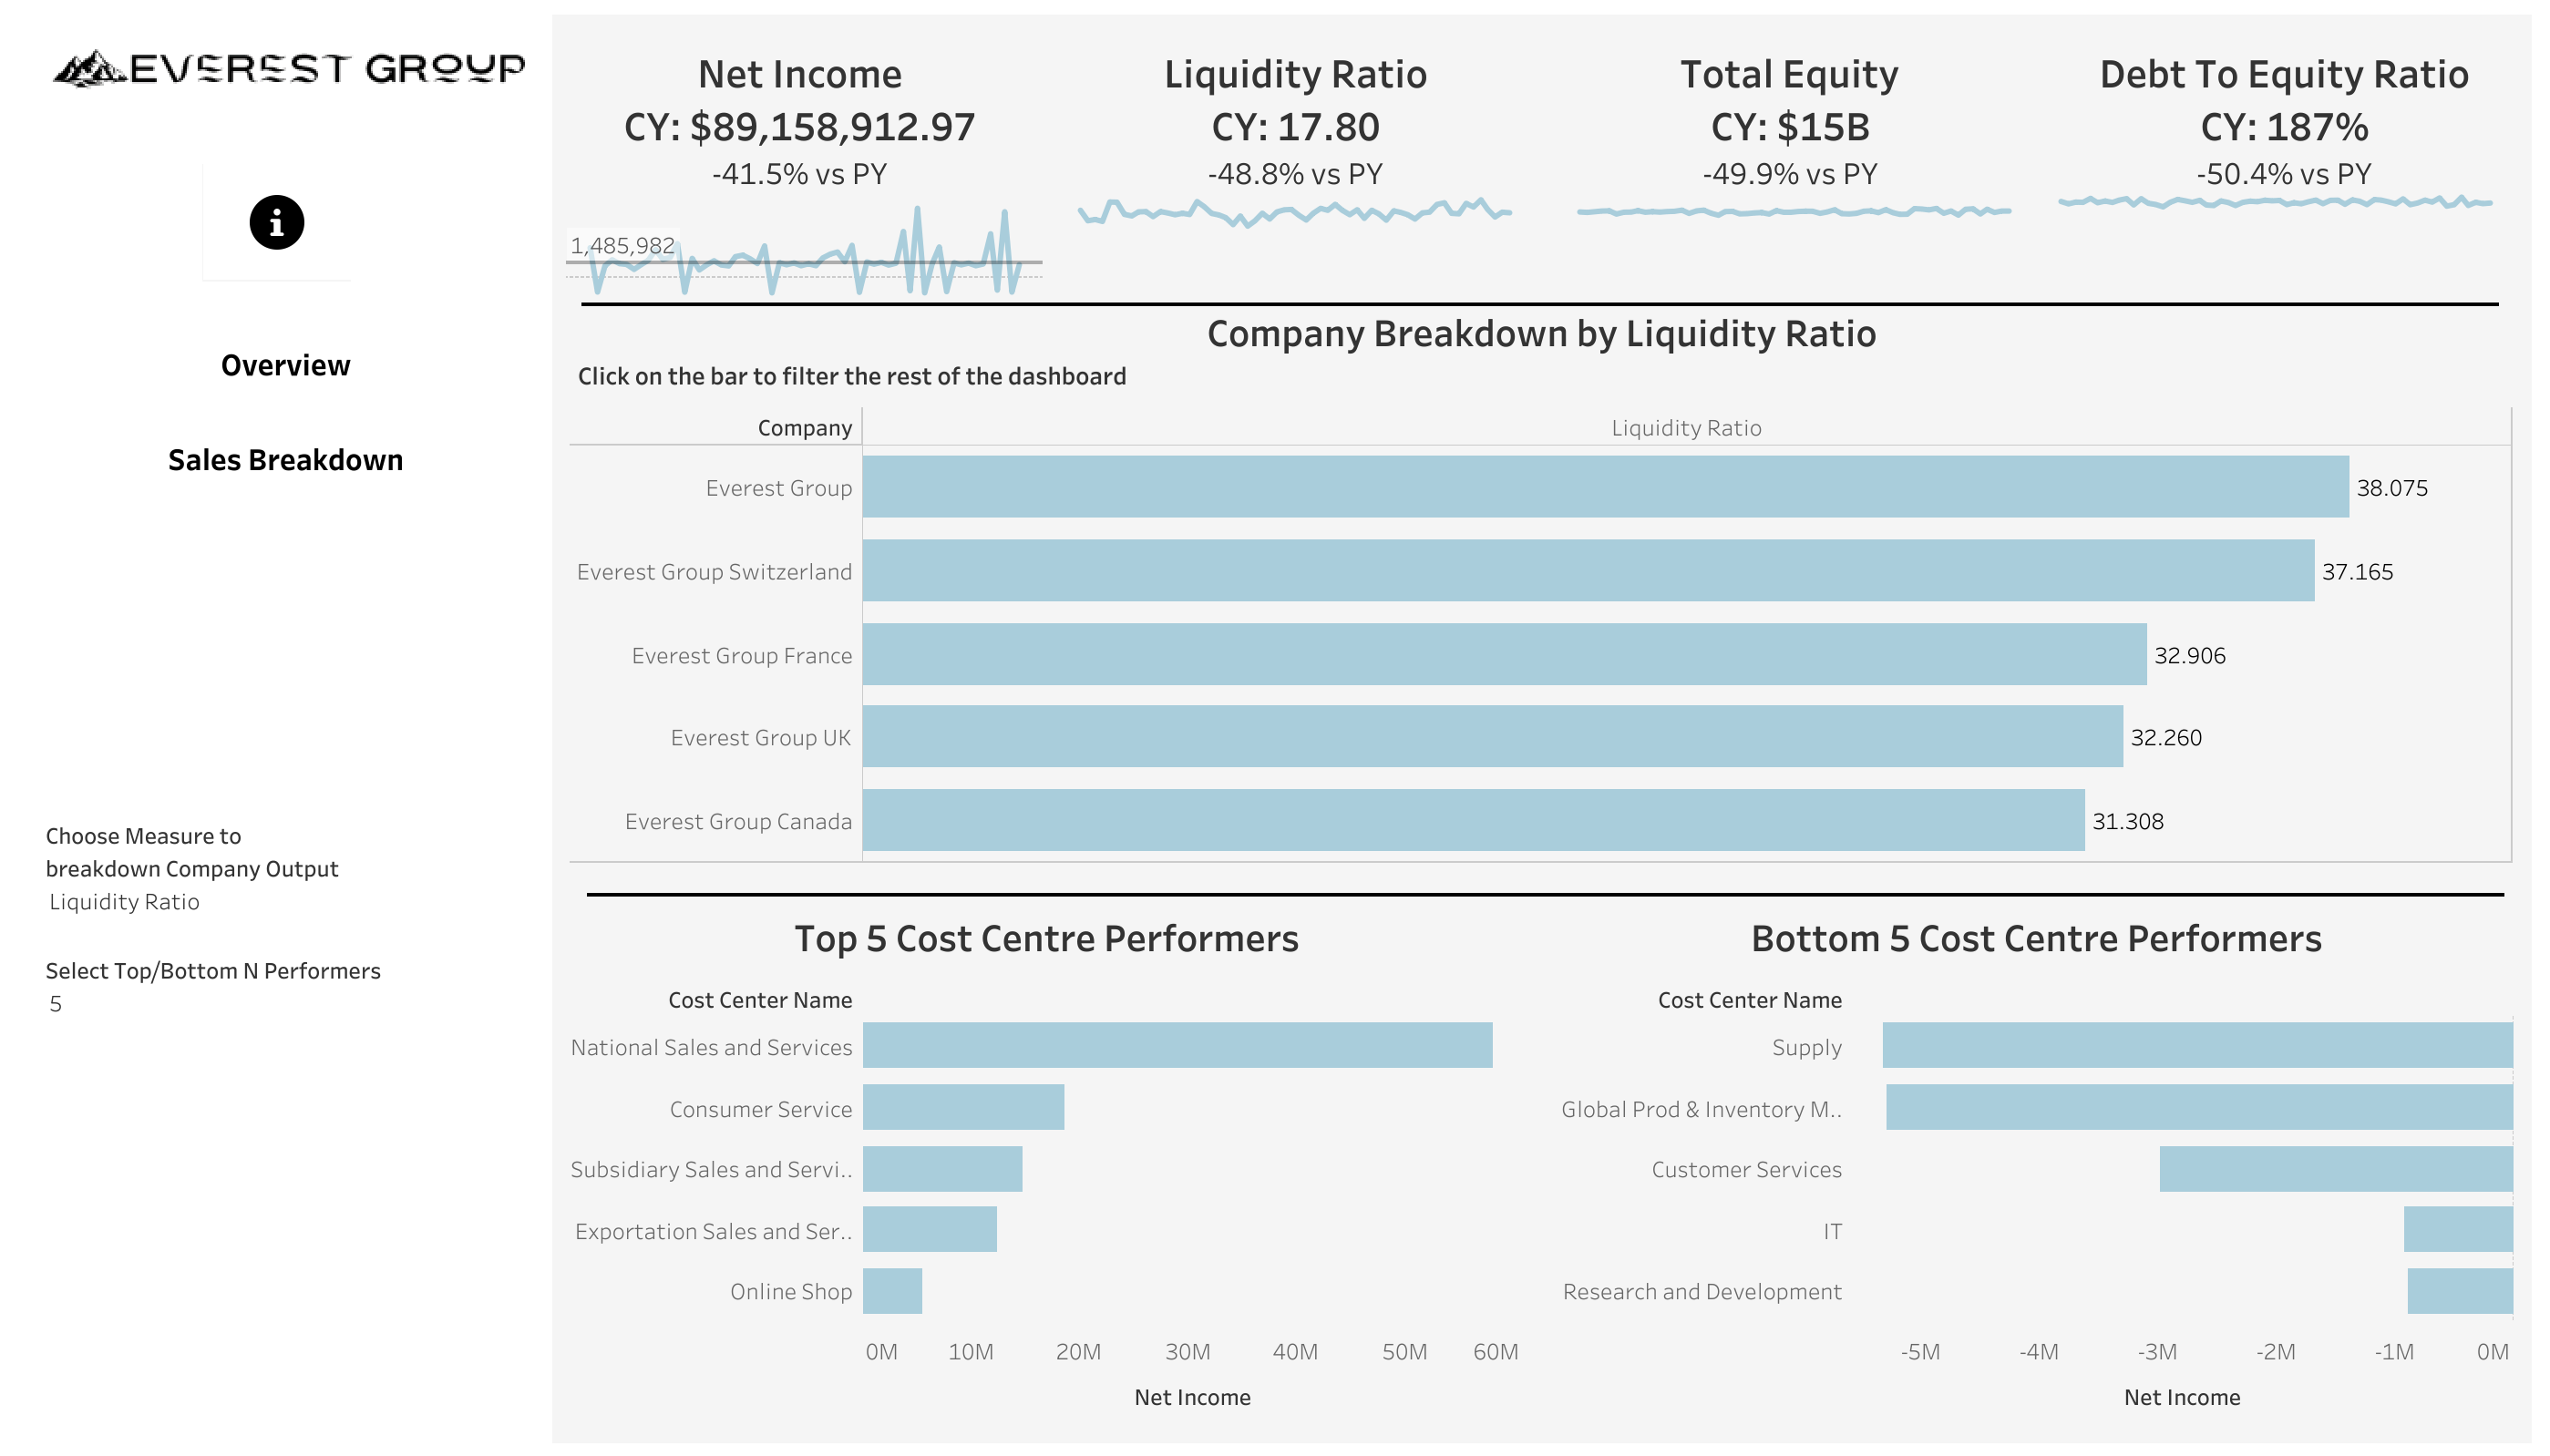
Below is the dashboard I created as an image:
The link is for the dashboard is here: https://public.tableau.com/shared/RTGDPDJ3D?:display_count=n&:origin=viz_share_link