Key performance indicators (KPI's) are a huge area that needs to be covered in most dashboards for companies as they offer important and easy to read statistics especially when comparing performance from the current to the previous year. There are two ways to do this in Tableau: using Level of Detail calculations or table calculations but we will focus on the latter.
Step 1:
For this example we are using the well known US Sample Superstore and we want to find out the current year sales compared to previous year sales for each region. So after loading the data source in, drag the discrete year of order date and the region field into the columns and rows. Also drag in the sum of sales field into the marks card as a text output.
Step 2:
Create a calculated field called Last, which uses the Last function. This function returns the number of rows from the current row to the final row. In this example, we want to have the current year, which is the latest year and hence, the first year. So in order to filter for the latest year, in the calculated field we put
Last()=0This will dynamically filter to the latest year so when the data is updated to 2023, the year output will be 2023 rather than 2022. Once this is done, put this on the calculated field on the filter and select true to return the latest year.
Step 3:
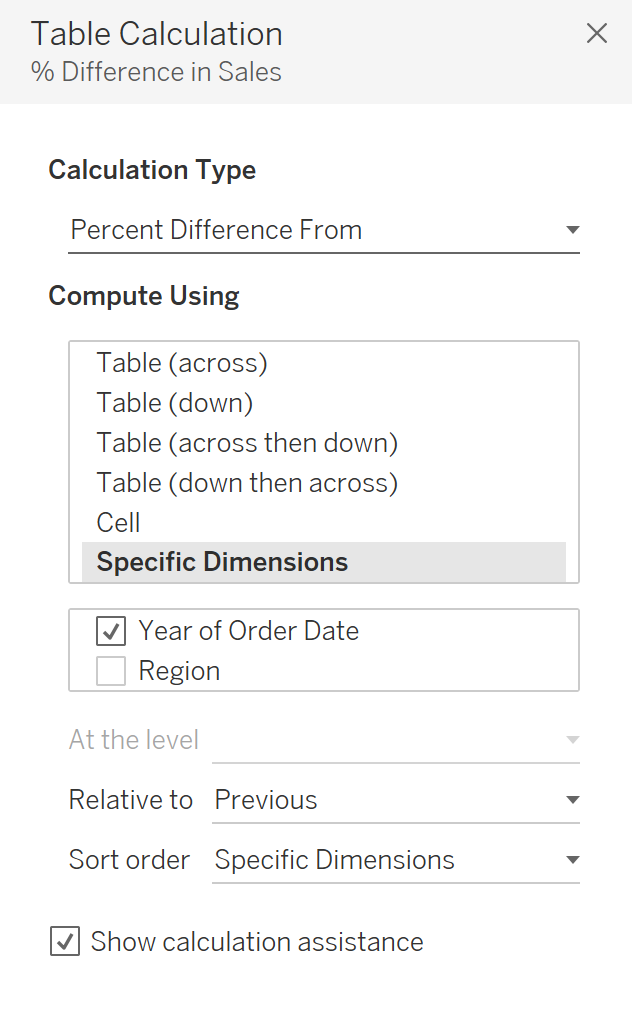
To get the previous year comparison, we will do this as a percentage difference from the current year. To do this, drag sum of sales on the marks card but as a detail mark. Then you can change the mark as a text mark. Now right-click on the sales field and add a table calculation and configure at is it in the picture below.
Step 4:
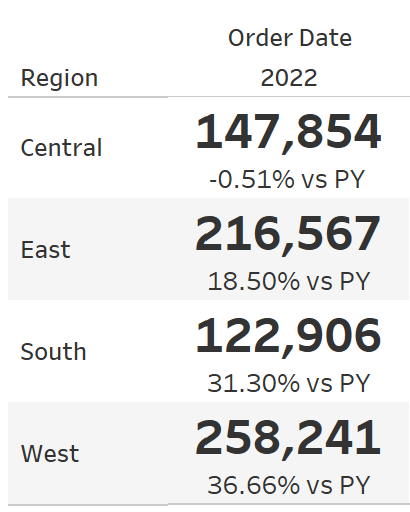
All that is left to do for a basic KPI is to format it and you can get an output similar to the image below.