For our most recent client project, one of the tasks set was to see how different socio-economic factors correlated with the provided target variable. We used Tableau’s WINDOW_CORR function to do this. In this blog, I’ll outline how to use this function using the default ‘World Indicators’ data set that Tableau provides, comparing it to the basic CORR function.
1. What Does the CORR Function Do?
To understand what WINDOW_CORR does, we must first understand what CORR does. The CORR function calculates the Pearsons Correlation Coefficient for two non-aggregated variables, from a scale of -1 to 1. The variables can be negatively correlated (as one increases by, the other decreases) or positively correlated (as one increases, the other increases).
2. What Does the WINDOW_CORR Function Do?
WINDOW_CORR calculates the Pearsons Correlation Coefficient for the whole view, between two aggregated variables. It is a table calculation (every ‘WINDOW’ function is a table calculation, calculating based on the level of detail that is in the view, or window) and is typically what we will want to use for finding correlations in Tableau.
3. WINDOW_CORR In Action
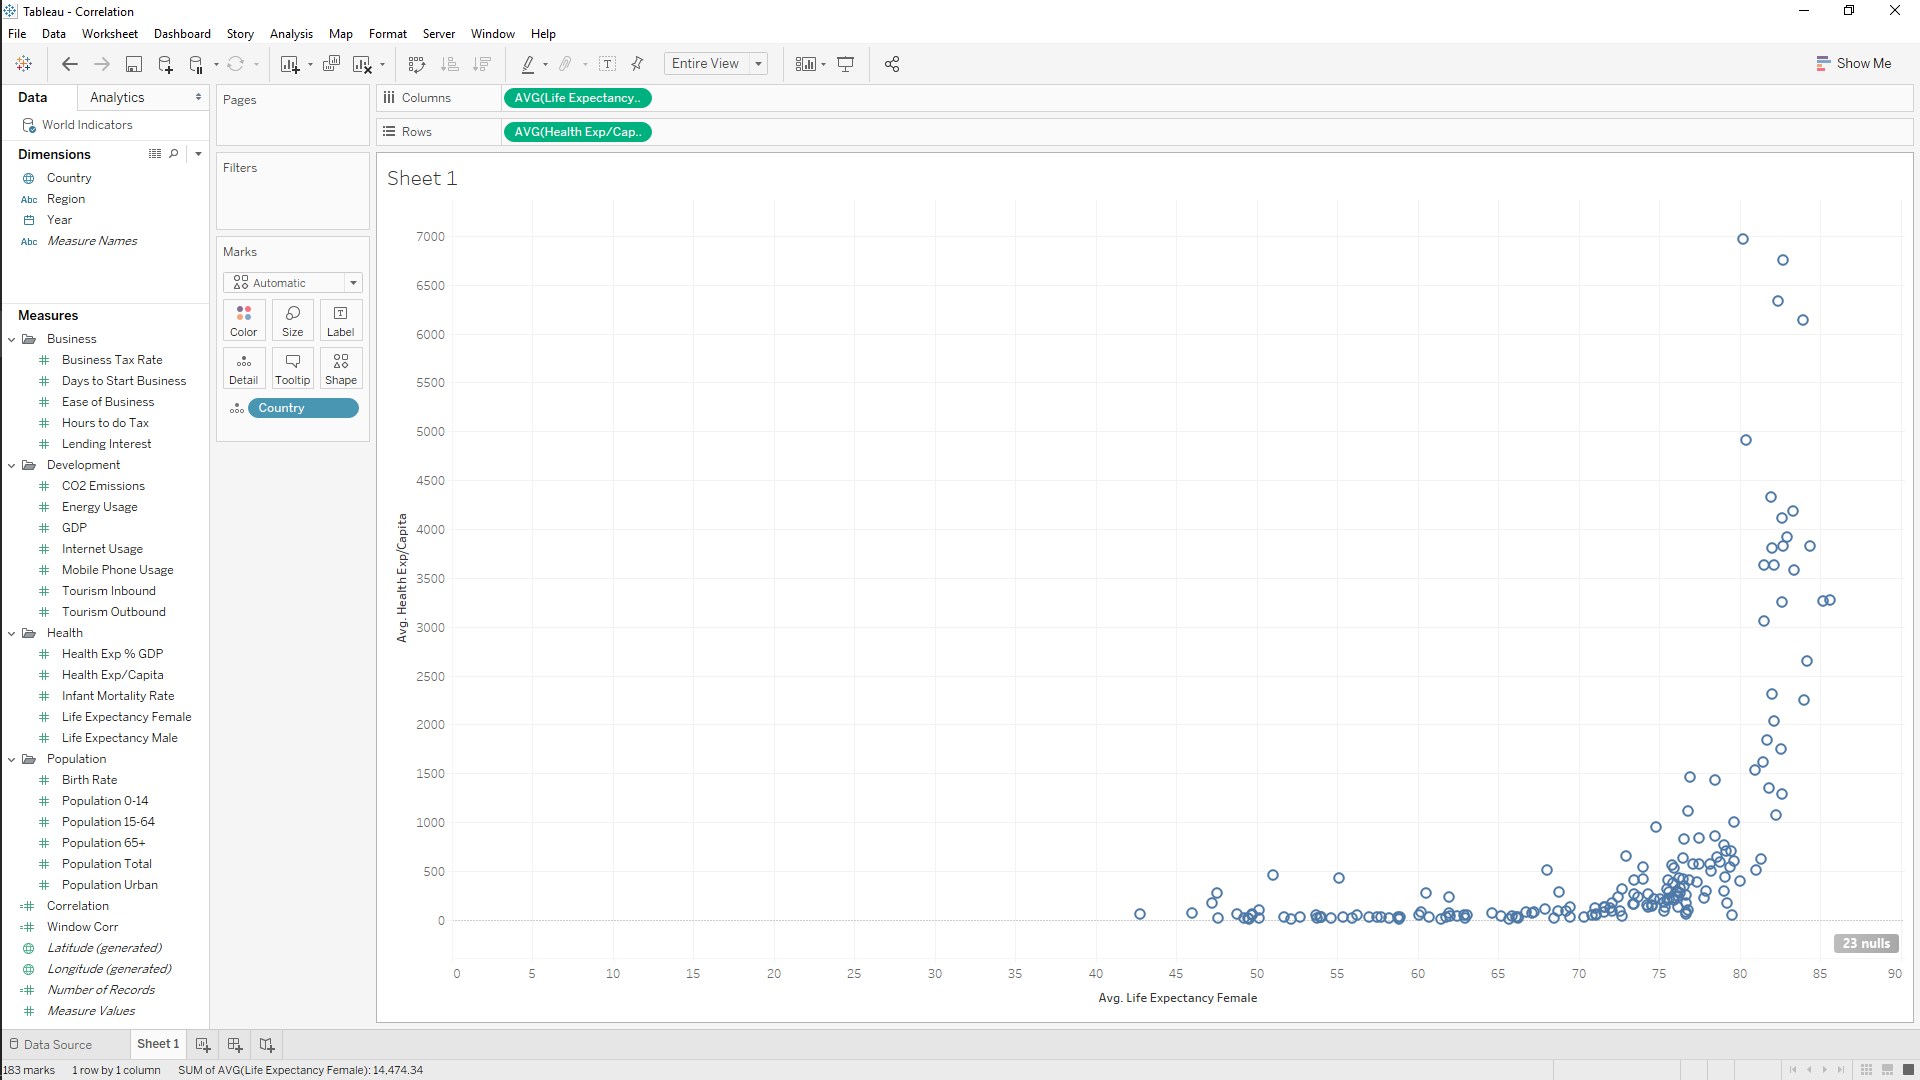
To clearly understand the difference between the two functions and to illustrate how to use WINDOW_CORR, let’s look at them in use in Tableau. I created a view comparing female life expectancy and health expenditure per capita and added ‘Country’ to detail to producing the following result.

It is obvious immediately that there is some sort of positive relationship between the two. As health expenditure increases, life expectancy appears to increase.
Now let’s create the two correlation calculations to quantify this. Go to the analysis drop-down menu and click ‘Create Calculated Field’. The syntax is as follows:
CORR function: CORR([Life Expectancy Female],[Health Exp/Capita])
WINDOW_CORR function: WINDOW_CORR(AVG([Life Expectancy Female]),AVG([Health Exp/Capita]))
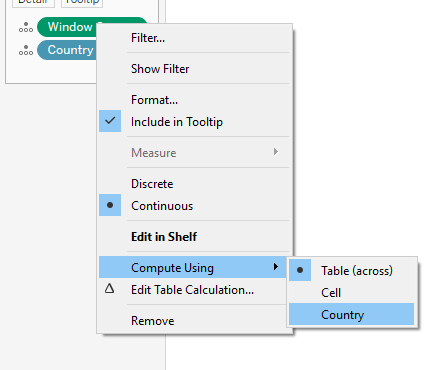
As we can see, CORR uses non-aggregated measures (e.g. [Life Expectancy Female]) whereas WINDOW_CORR requires aggregated measures (e.g. AVG([Life Expectancy Female])). It is important to note that as we want to take every country into account to find the correlation, we must right-click on the WINDOW_CORR calculation and ‘compute using’ country:

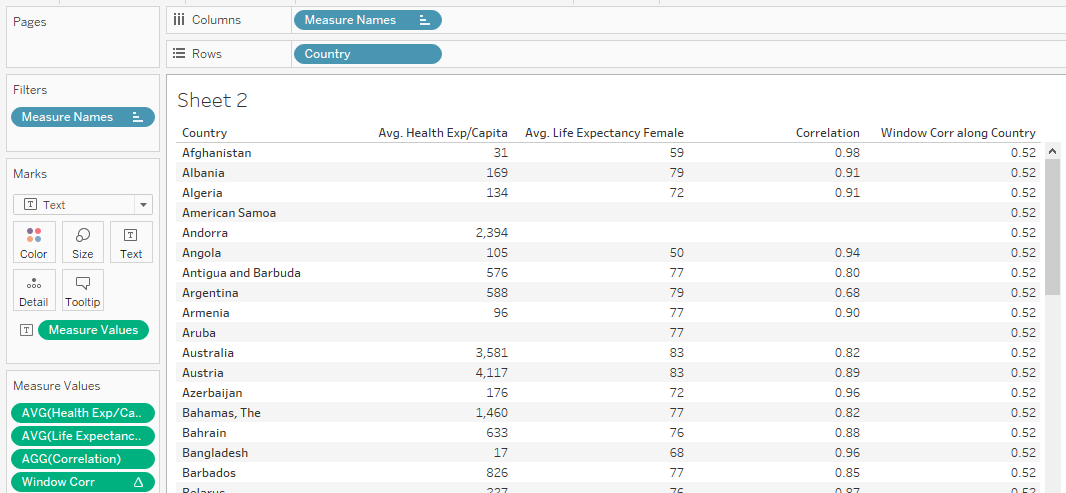
If we now look at the results in a table, we can see how each calculation is working.

CORR is finding the correlation on a row by row basis, giving us a distinct value for each country. We would however like to find out how life expectancy and health expenditure relate to each other based on all the country data we have. Therefore it makes sense to use WINDOW_CORR, as we will get a single value for the whole country set, as illustrated above.
I really like how easy Tableau has now made it to calculate the correlation coefficient. Before Tableau 10.2, these correlation functions did not exist and far lengthier methods were required.
I hope you enjoyed this blog! Please comment or contact me if you have any questions. For more from me, check out my Twitter and LinkedIn pages.
