


Lets make a report which looks at our top selling products and includes a dynamic subtitle which updates based on our selected Top N products.
This blog is based on #WOW2025 W34
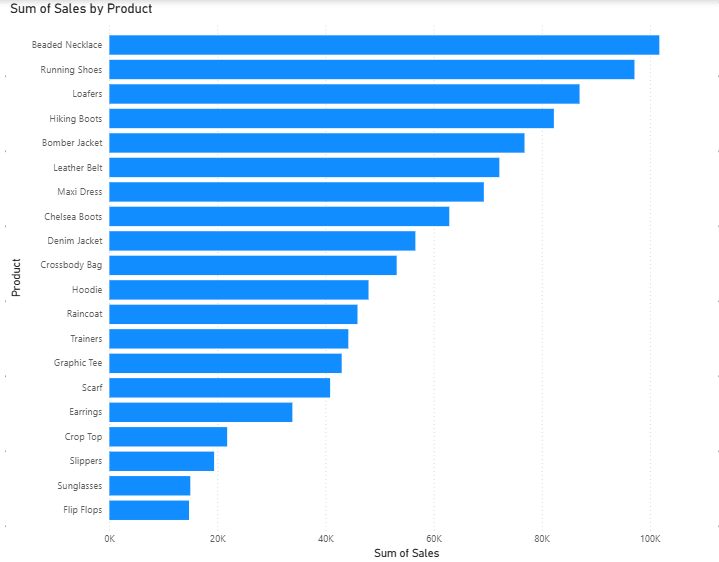
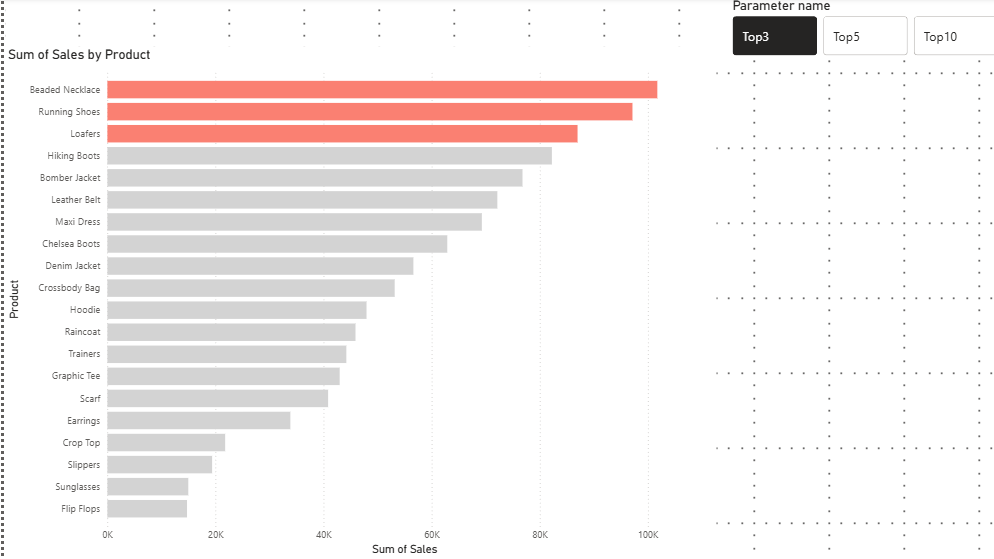
Firstly, lets create the base for our bar chart, which will simply include our products on the Y-axis and our Sum of Sales on the X-axis. With products sorted from most to least sales.
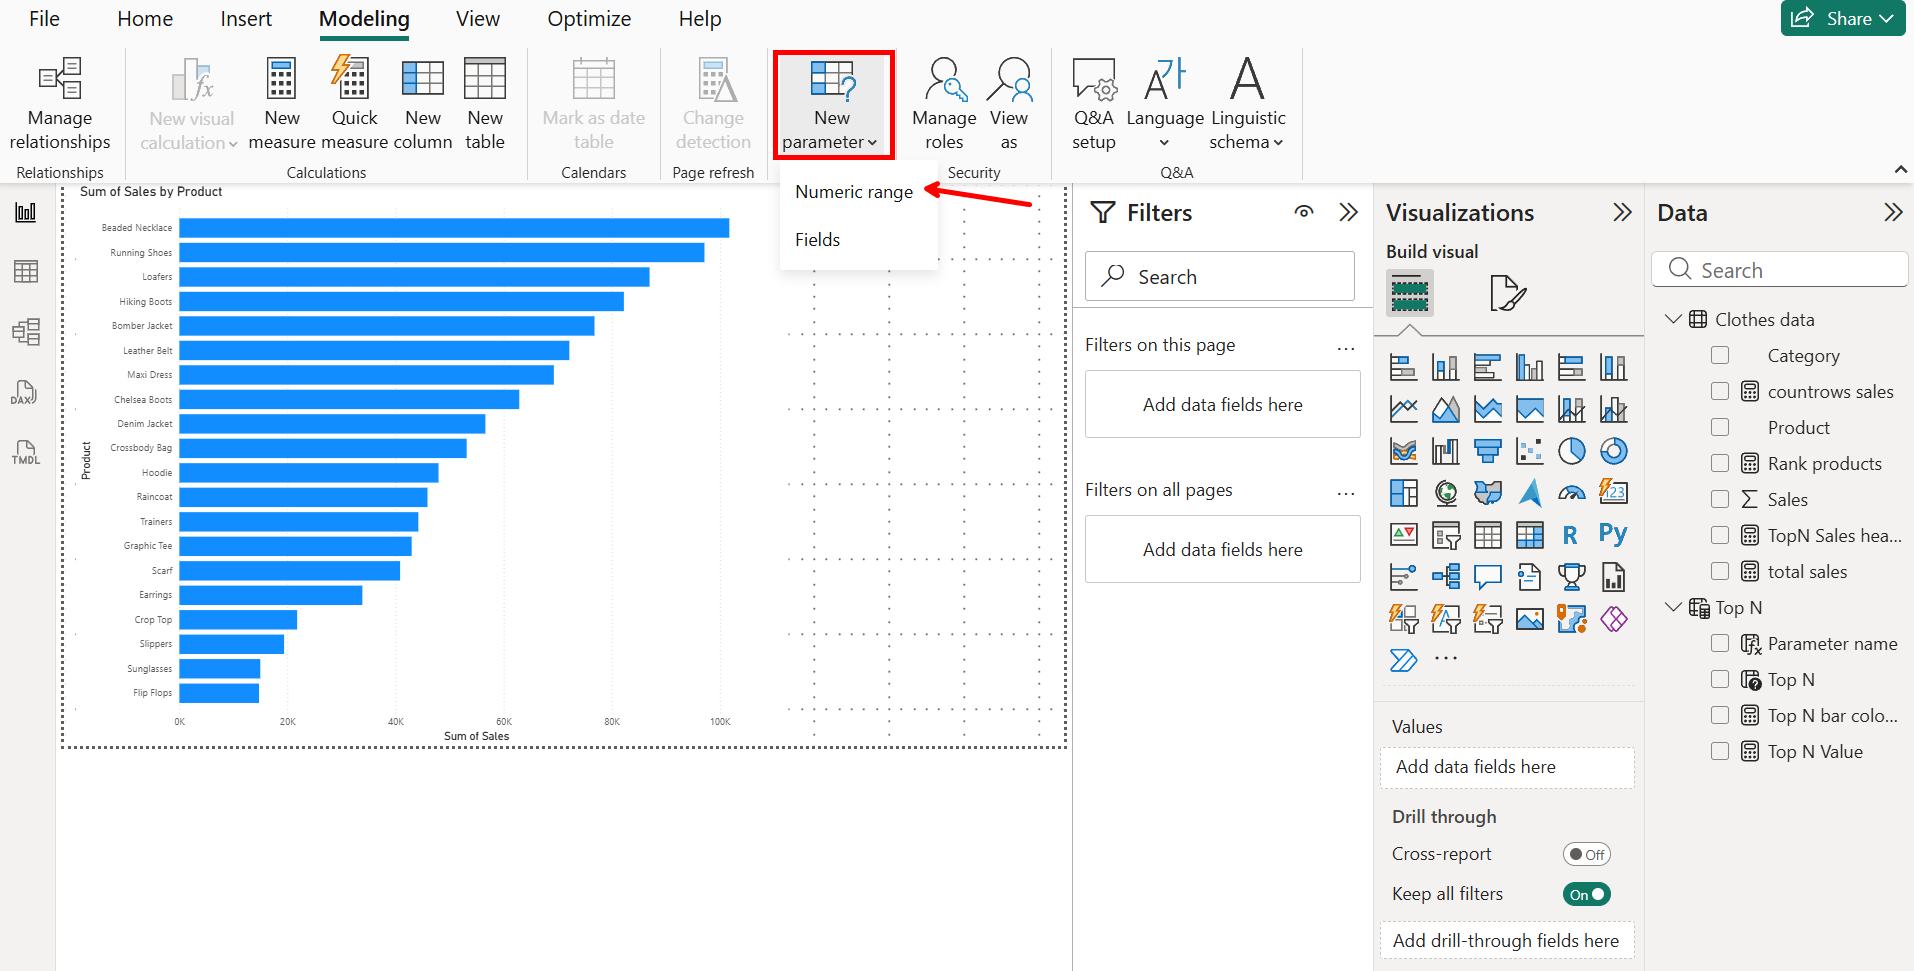
Now that we have our bar chart, we need to make our Top N parameter, which we'll use to highlight certain products later on. For this parameter we need to select numeric range.
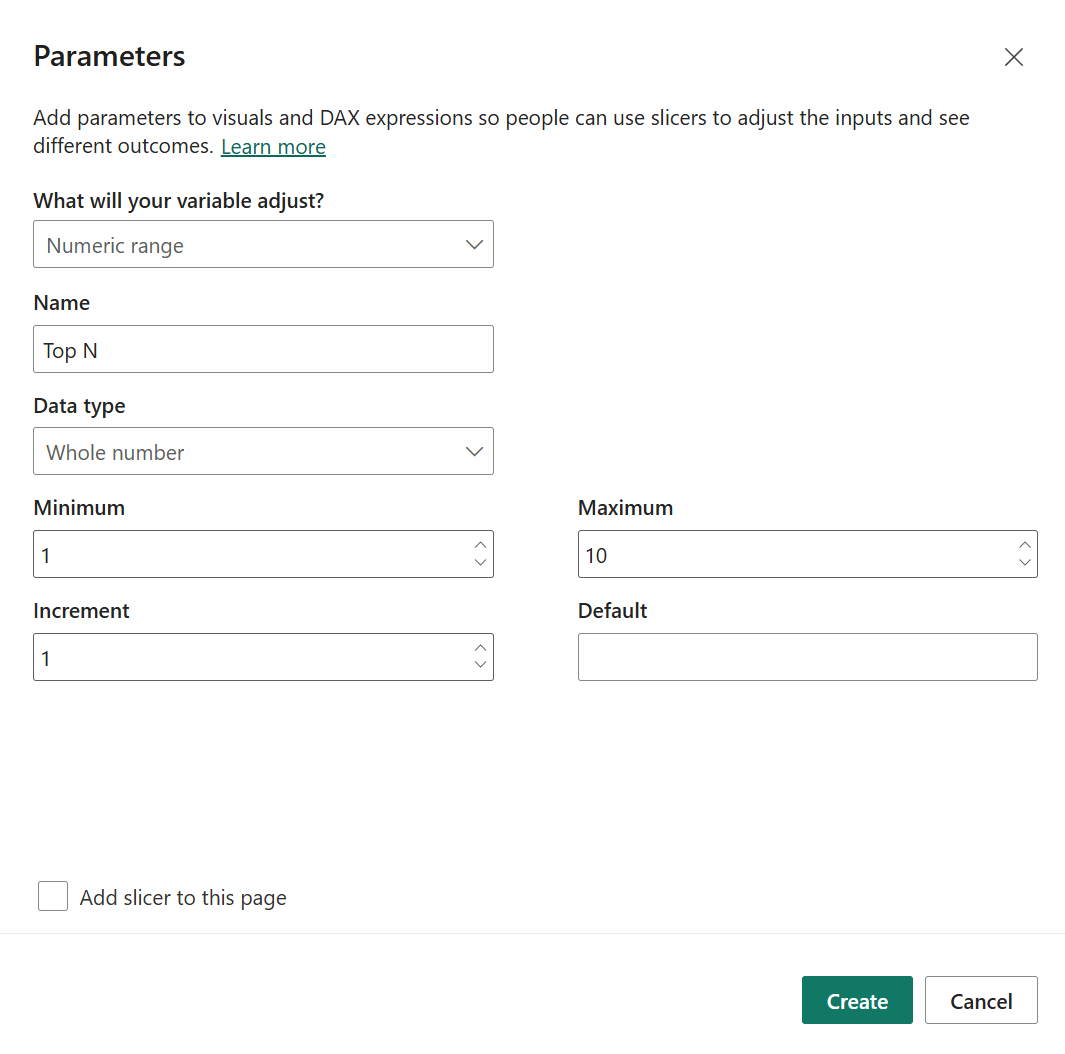
Lets call this parameter Top N and give it a minimum value of 1 and a maximum of 10, going up in increments of 1.
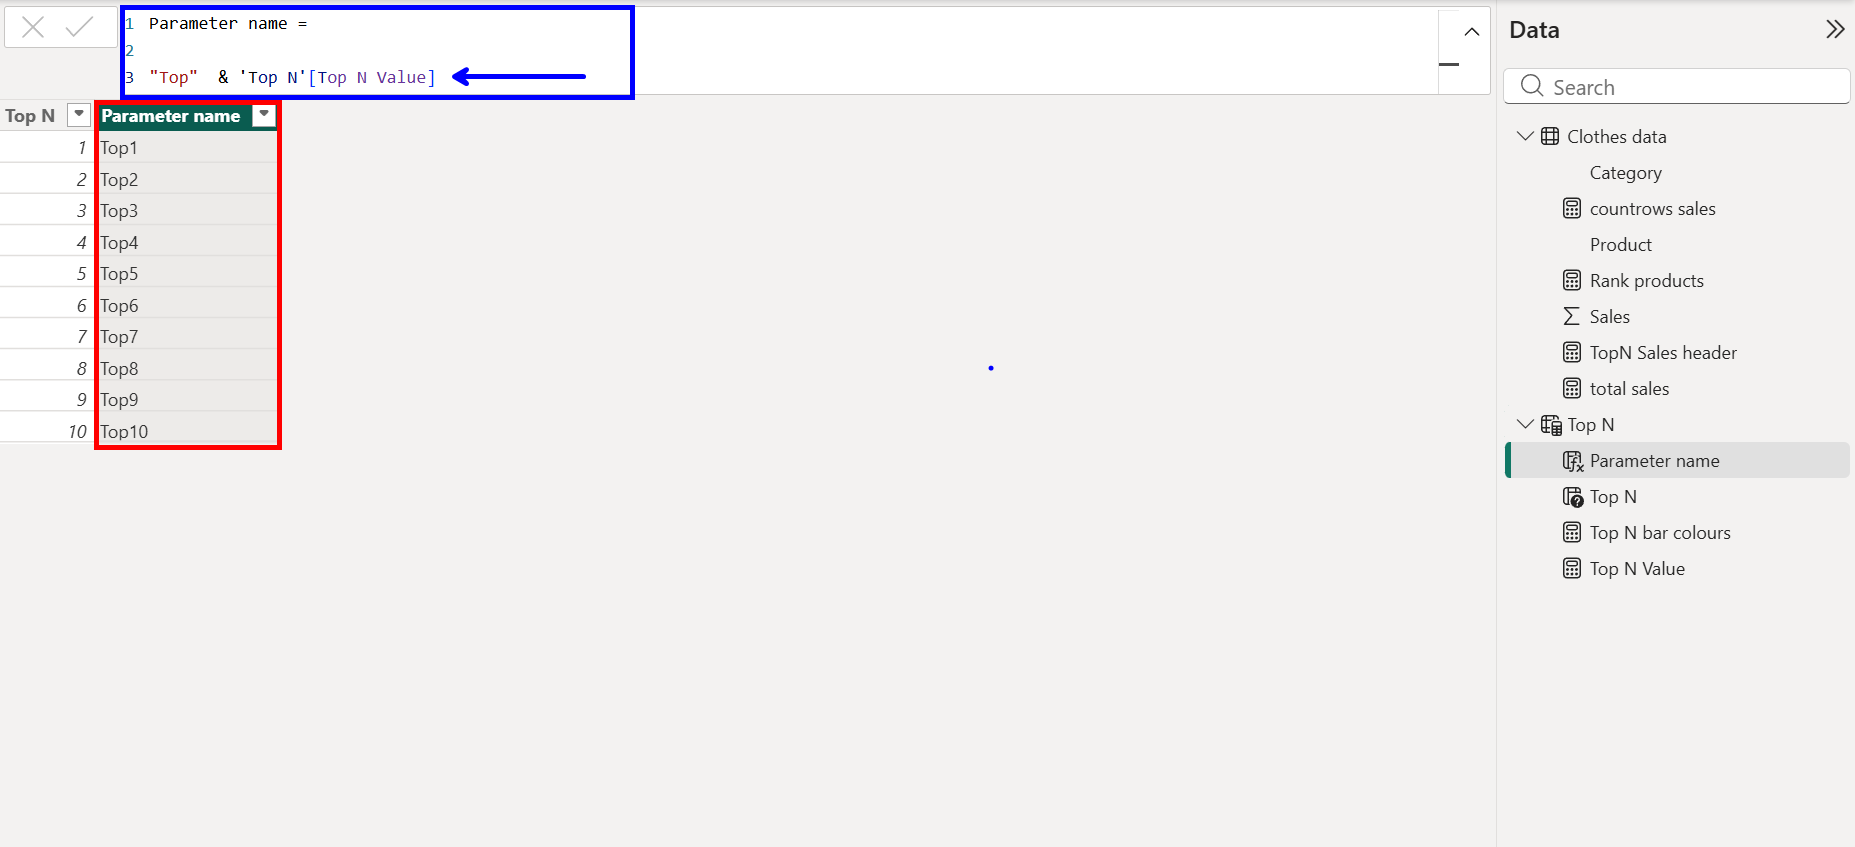
Now that we have our parameter values, lets give it a nicer name to place on our Top N buttons later on.
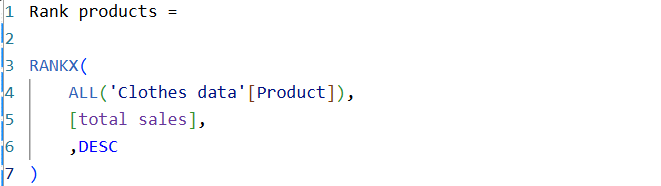
Now that our parameter is set up, we need to start working on creating our Bar colour measure, whereby only the Top N bars will be coloured. To do this we need make a measure for Total sales. After this we can rank our products. This calculation will rank all of our products in terms of total sales with the highest sales total being 1 and each subsequently descending bar after being one number bigger.

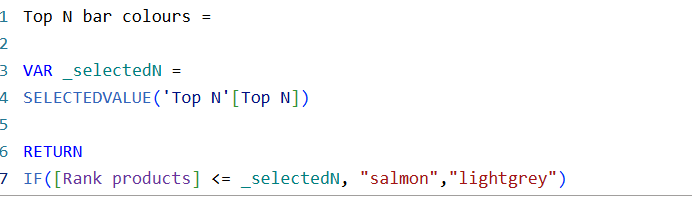
Now that each product has been assigned a rank value we can create our Top N bar colours measure. This measure used VAR which allows you to essentially make measures within a measure, here we created _selectedN which will return the current value within our Top N parameter. RETURN equates to the actual measure you want to create, in this case a measure which will make any product ranked >= to our Top N value salmon coloured while those below stay a light grey.
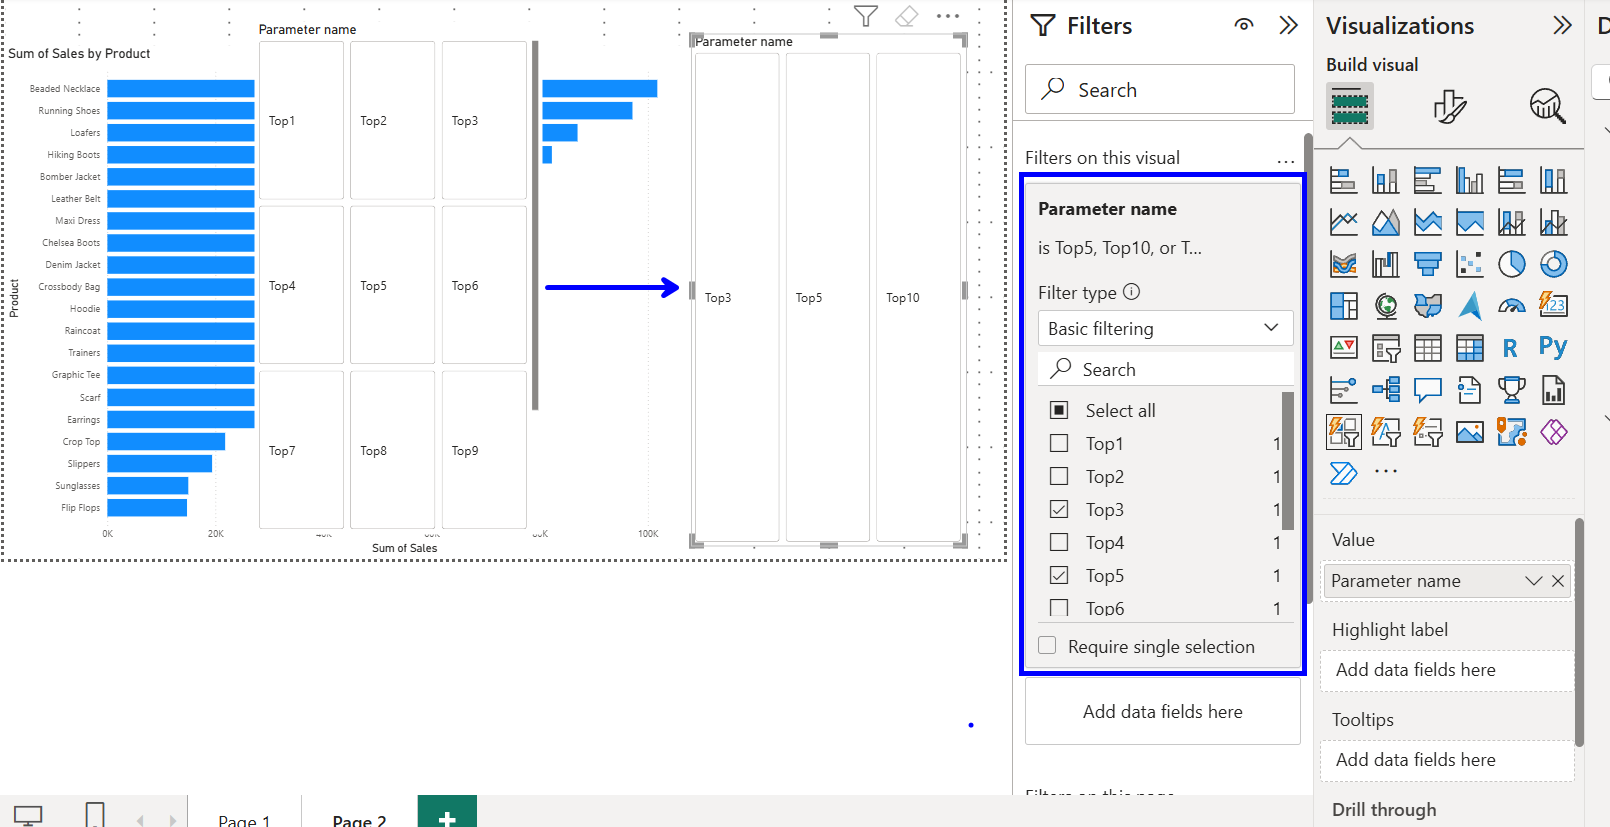
Before we colour our bars lets neaten up our Top N buttons. As we can only produce numeric parameter values through increments if we only want our Top 3, Top 5, and Top 10 buttons then an easy way is to simply filter out the other parameter values. Now we just have our 3 buttons.
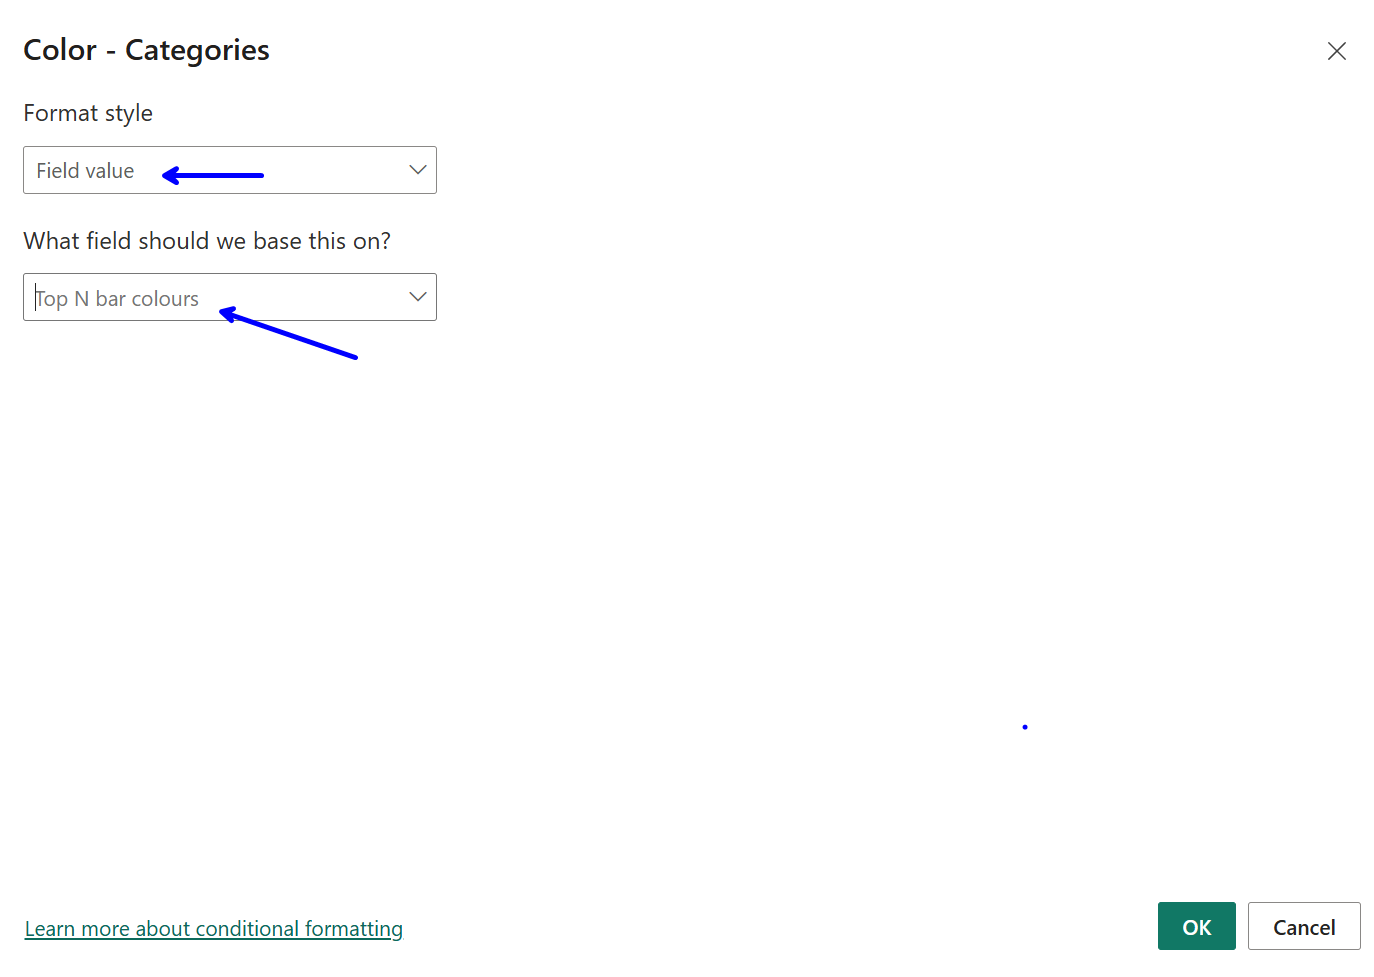
Next lets go format our bar colours. To do this go into Bars and select fx within here we can change our format style to field value and base that field value on our Top N bar colours measure. Now as you can see in the following image our bar colours will update with our parameter.
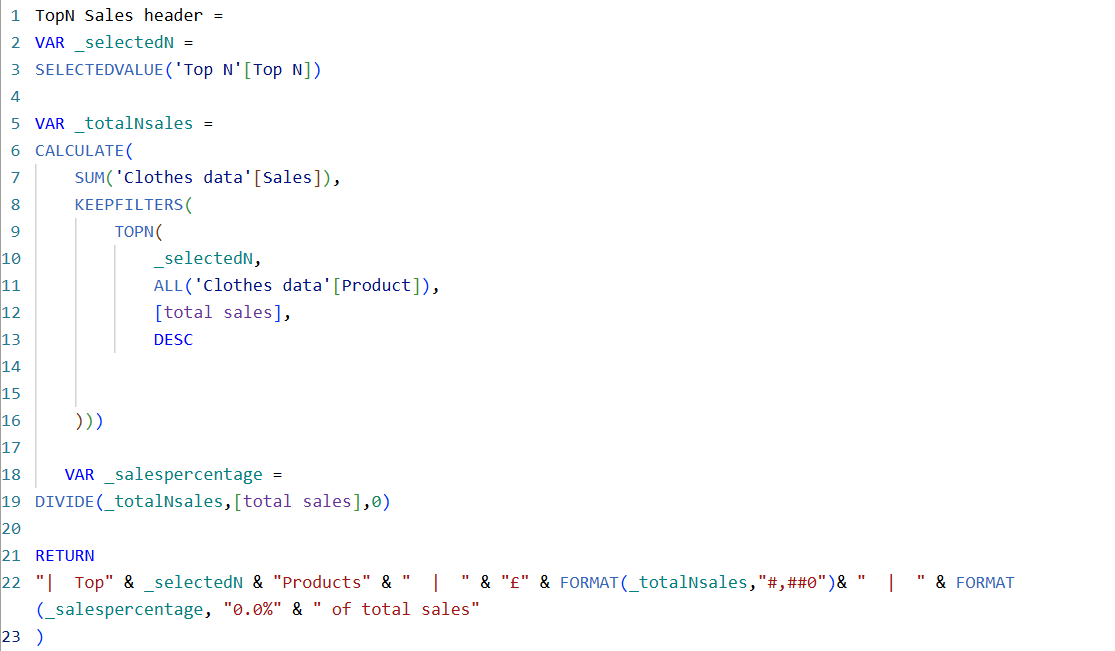
The next step is to create our dynamic report subtitle. To do this we are once again going to use our good friend VAR. Firstly, I have once again created our _selectedN variable. Now I need to make a variable which only returns the total sales for our "coloured bars," this calculation in essence is saying to sum the total sales for all products ranked down to our parameter value (e.g., Top 3 = the sales of the top 3 products). The final variable we require is _salespercentage, the percentage of the total sales our Top N values makes up. This variable is simply our Top N sales divided by our Total sales.
Finally, within this measure, we need to create our dynamic subtitle. This requires us to write out a measure which combines both strings and our variable values. We also must FORMAT out _totalNsales & _salespercentage values to our desired look.
Now we have our dynamic subtitle, lets first update the reports actual title to "Top Performing Products."
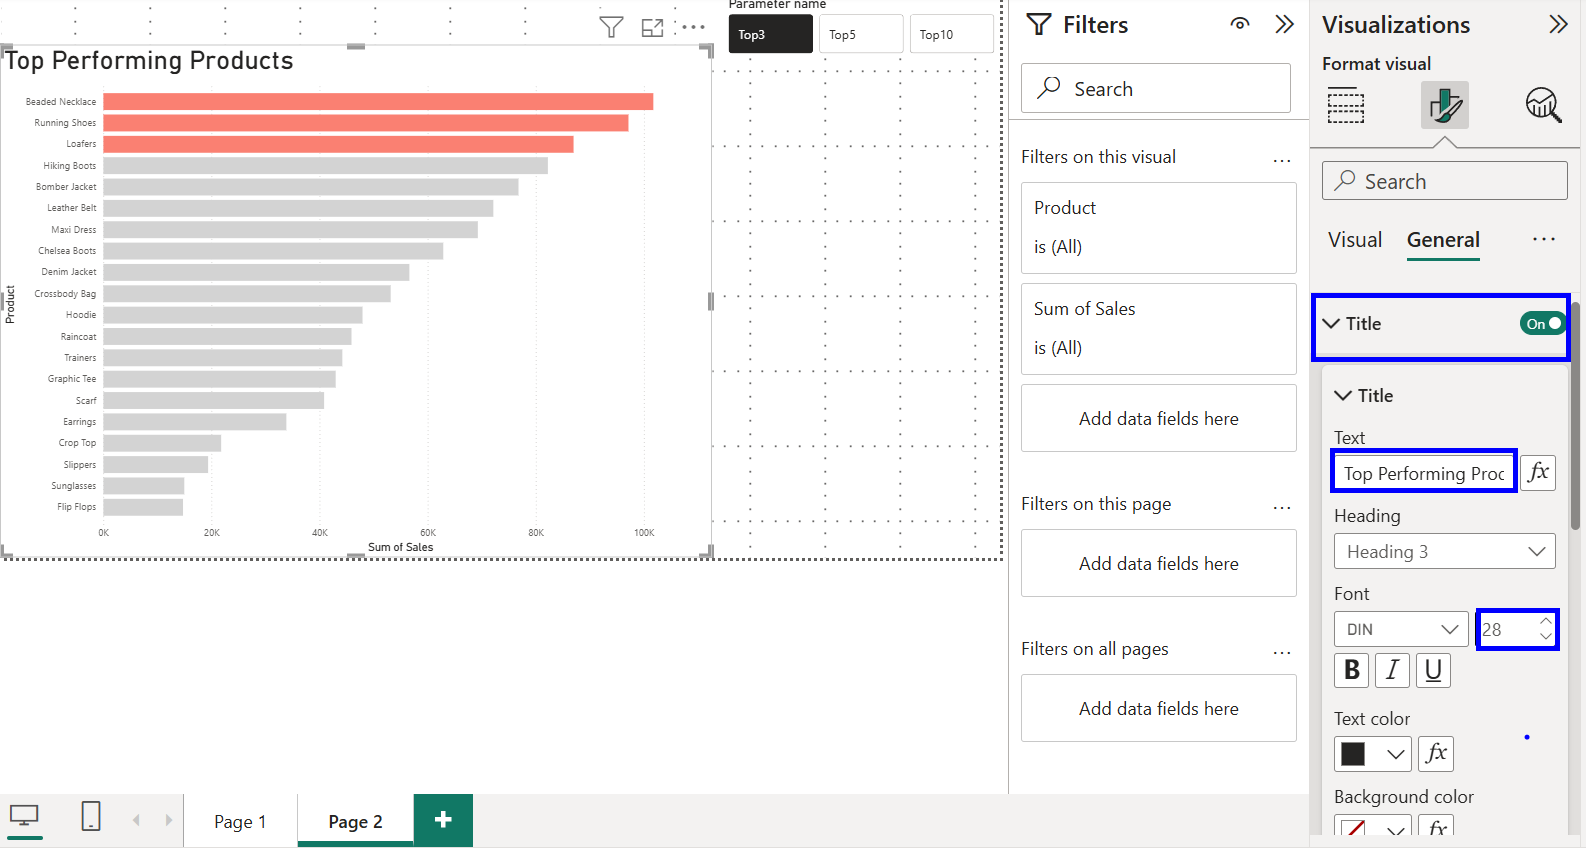
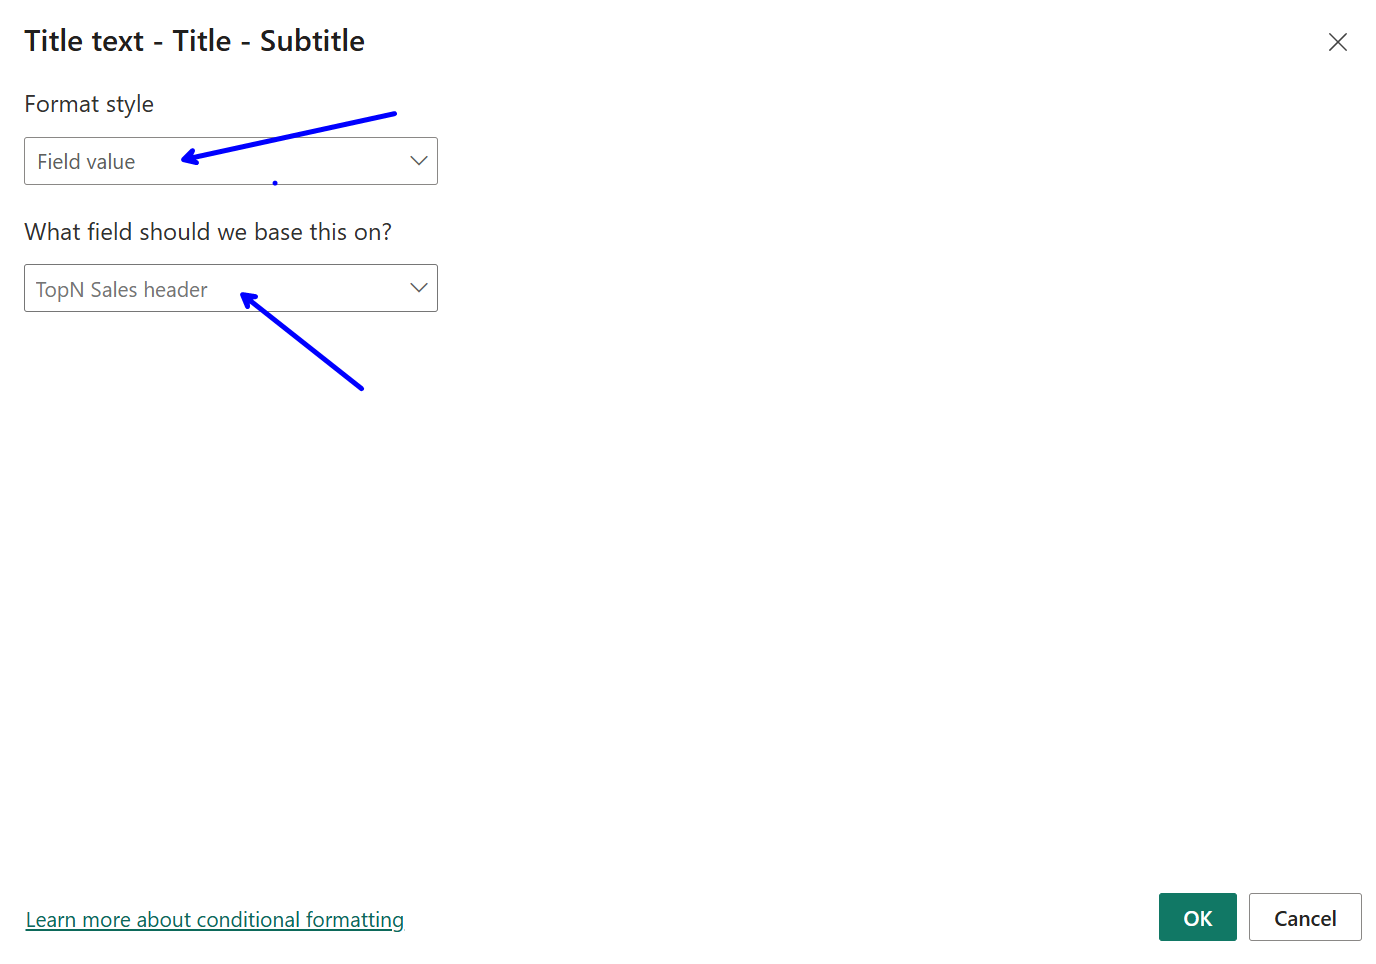
Underneath the Title section we can now also find, and turn on, subtitle. Now to make our subtitle dynamic we need to press fx.
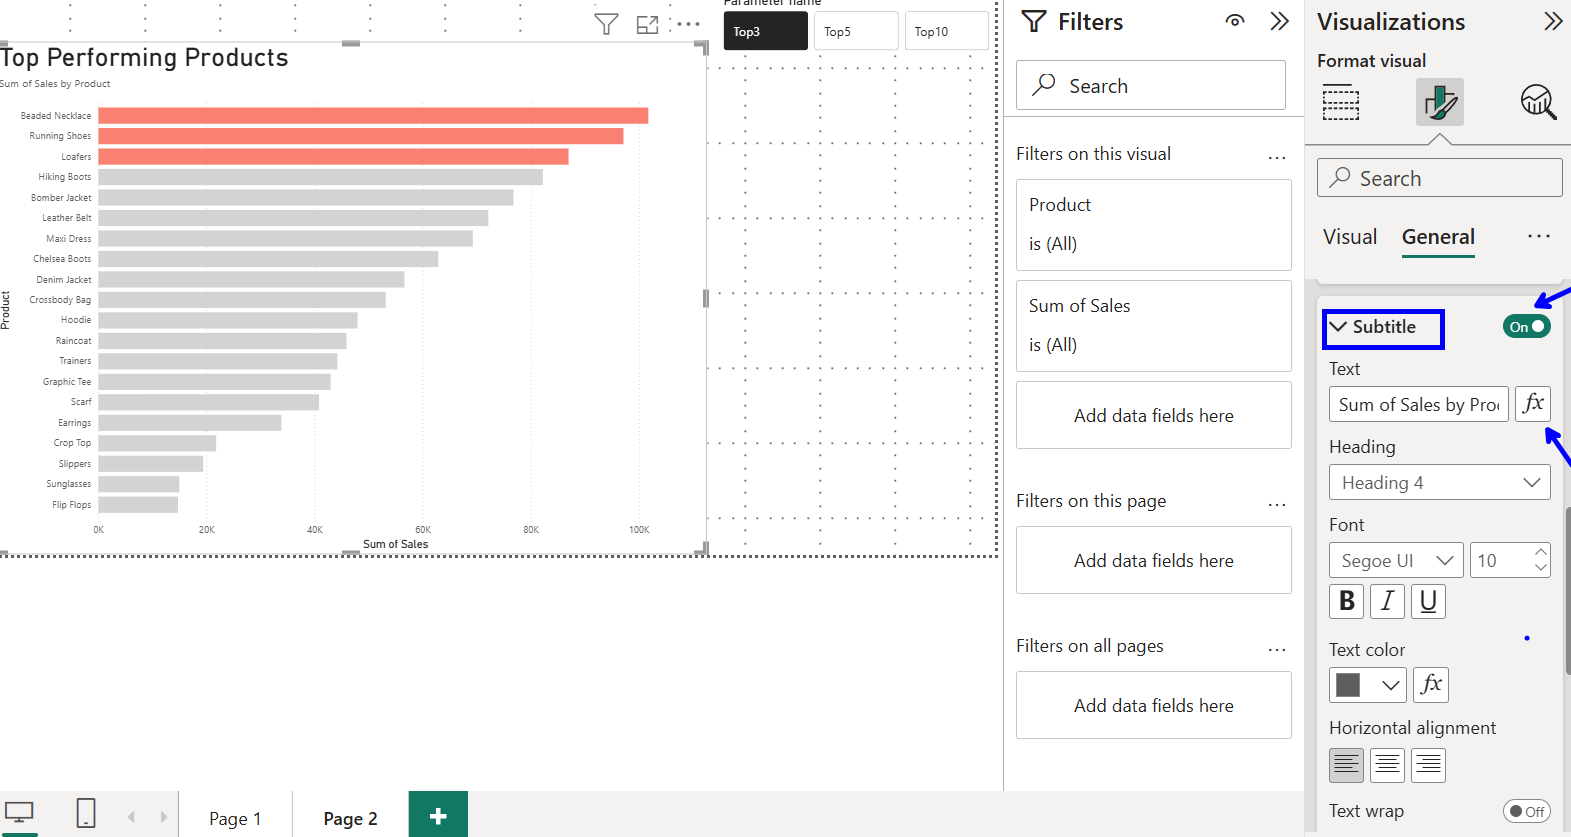
Just like our bar colours before, we need to change our format style to field value with the value its based on our TopN Sales header.
Now we have a nice Top N report which includes a dynamic subtitle.