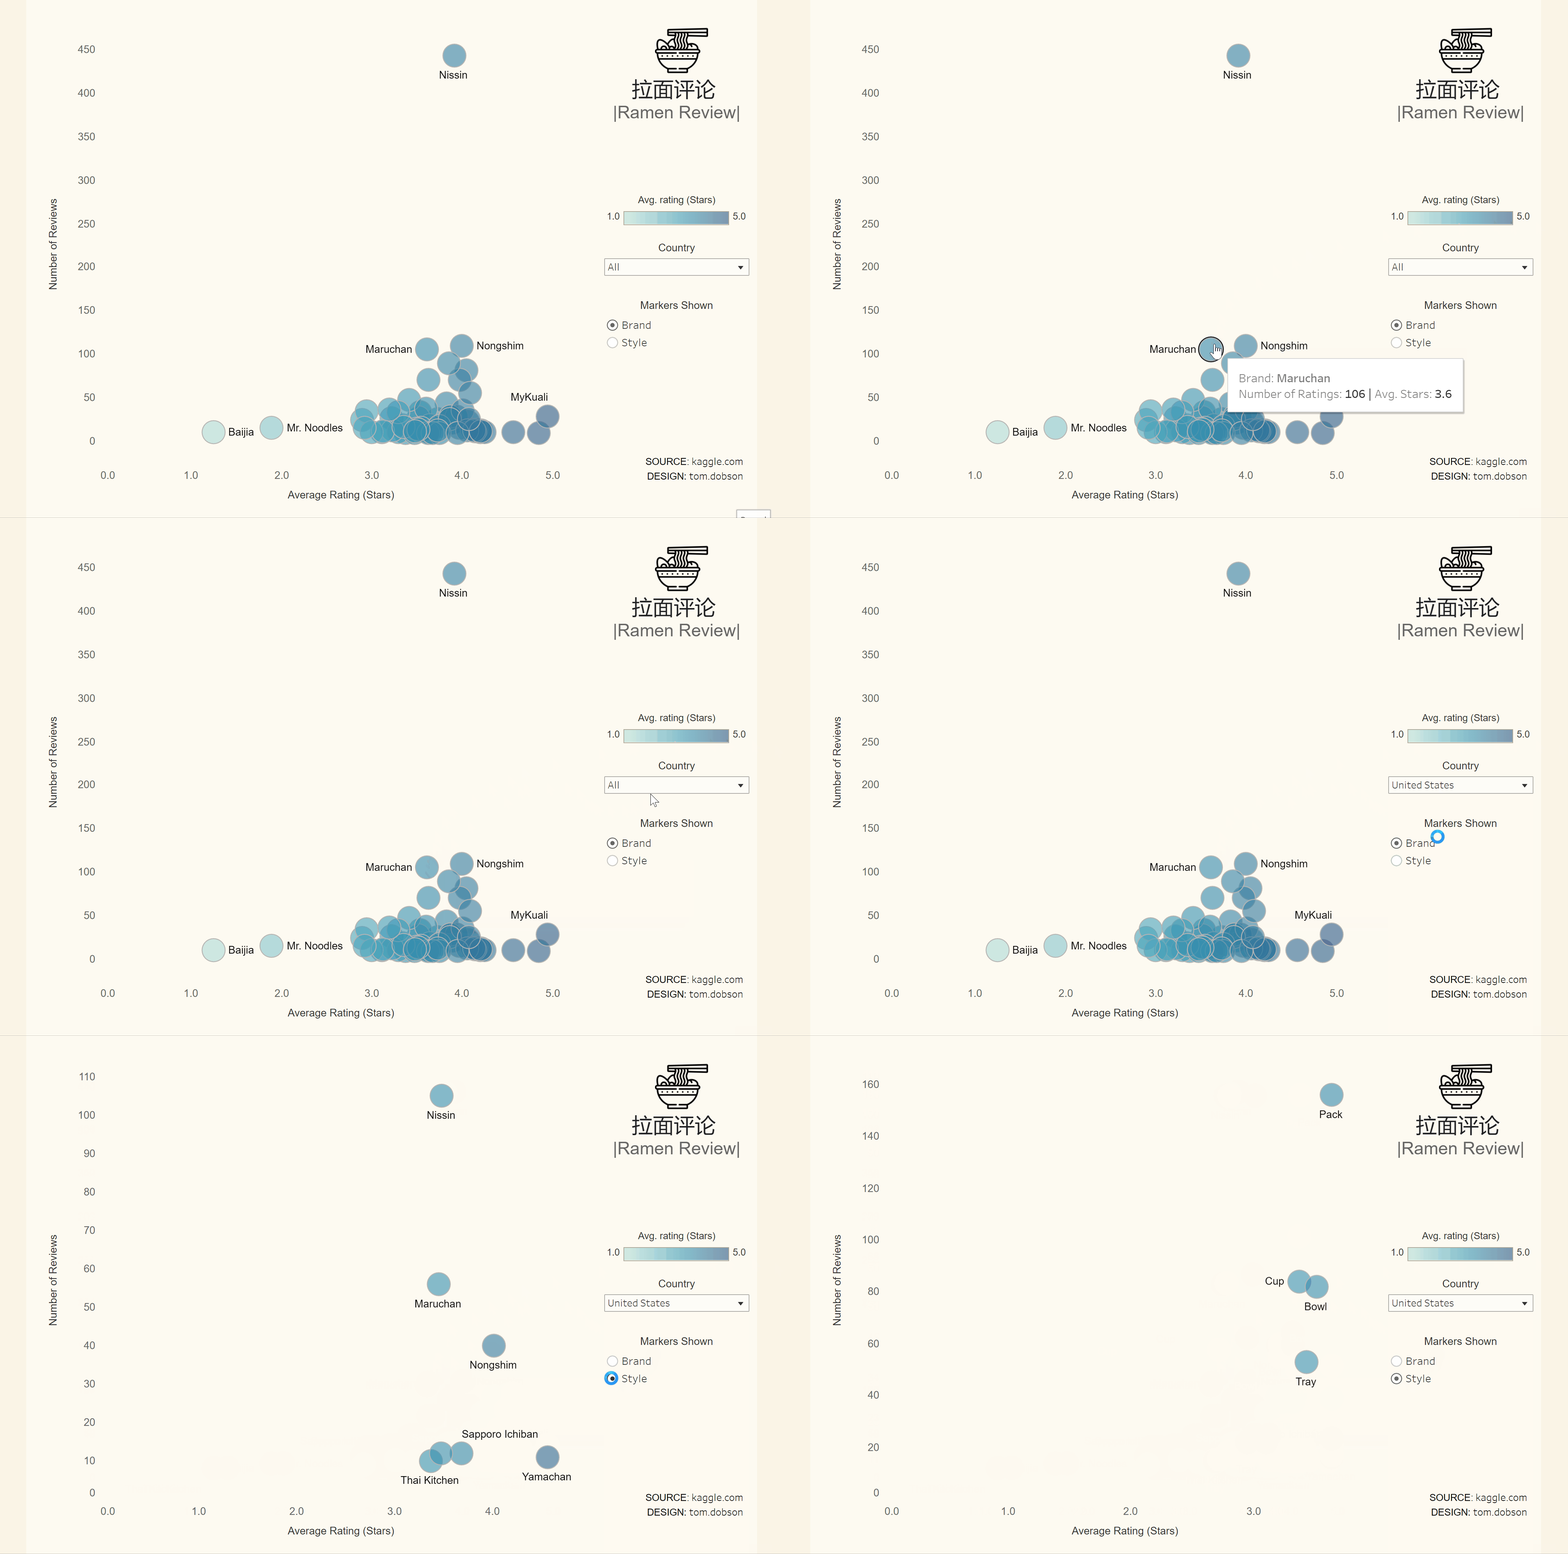
It was a sunny morning at The Information Lab, and my cohort was exploring parameters and parameter actions. These can be used to let the end-user filter on-screen data, opening up new possibilites in terms of insights that can be gained for a dashboard. My cohort's task was simple: choose a dataset, visualise it, and implement parameters by 17:00. To minimise time wasted on data cleaning, I opted for a straightforward dataset containing reviews for ramen products. Here's what I was able to produce by the end of the day:

Here's how I incorporated parameter-based filtering into the dashboard. After building a basic scatter plot, I created a parameter and assigned it the values that I wanted the user to be able to filter by (in this case brand, style, and variety). The parameter is activated with a calculation that returns different slices of the data based on the value of the aformentioned parameter. This can be placed on the details shelf within the marks card, which tells Tableau to plot the slice of data selected in the parameter. We can enable users to change the slice shown in the chart by right-clicking the parameter and selecting 'Show Parameter'.
CASE [Select Detail Parameter]
WHEN 'Brand' THEN [Brand]
WHEN 'Style' THEN [Style]
WHEN 'Variety' THEN [Variety]
END
By and large, the same method can be used to enable filtereing based on country. In this case, however, we can populate the parameter with all countries in the data by choosing 'Add values from' and then selecting the 'Country' field. We also want to manually add an 'All' option which will return data for all countries. This parameter can be activated with a an expanded calculation which returns all values when the country parameter is set to 'All'.
IF [Country] = [Top 15 Countries Param.] THEN [Country]
ELSEIF [Top 15 Countries Param.] = 'All' THEN [Country]
ELSE NULL
END
