Ever needed to use multiple chart types in one dashboard? Use parameters to switch between them
I recently gave a talk at Tiny Tableau Talks in London where I ran through some examples of how to save space in Tableau dashboards. This can be really useful when you want to show extra layers of detail, but without cramming everything in to one dashboard. Here I will explain how to do one of those options – parameter chart type control.
Using parameters to switch chart types can be really useful when you want to show the same data but in a different way – in this case with a map and then with a bar chart. Geographic displays can be quite challenging to see differences between very similar values – so by adding the option to display the data in a bar chart we can give the viewer better insights.
Here’s how to do it!
1. Build your charts
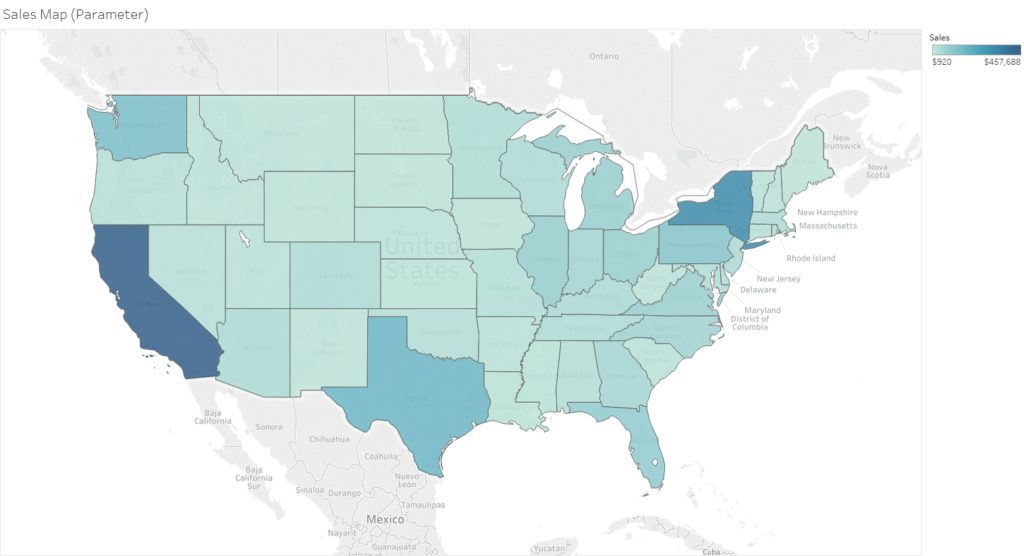
Sounds obvious I know. But build up a couple of charts (or more, there’s no limit to how many you can switch between). Here I have made a map and a bar chart using Superstore sales.
2. Create a parameter
Next up, all we need to do is build a simple parameter. If you don’t know much about parameters , they are a great way to give your user the option to view data/charts at their desired level.
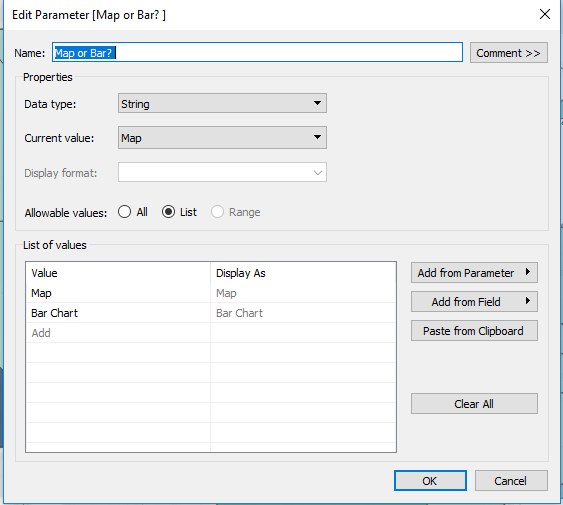
Right click in the dimensions pane and click on ‘Create Parameter’. Call it something relevant for you and then set it to a string and then list of values. Enter reasonable names for your values – mine are map and bar. The set up for the dialog box is below:
Now right click on the parameter and click on ‘Show parameter control’
3. Link the parameter
Parameters are user input values. So for them to work in Tableau we must link the parameter to our view using a calculated field.
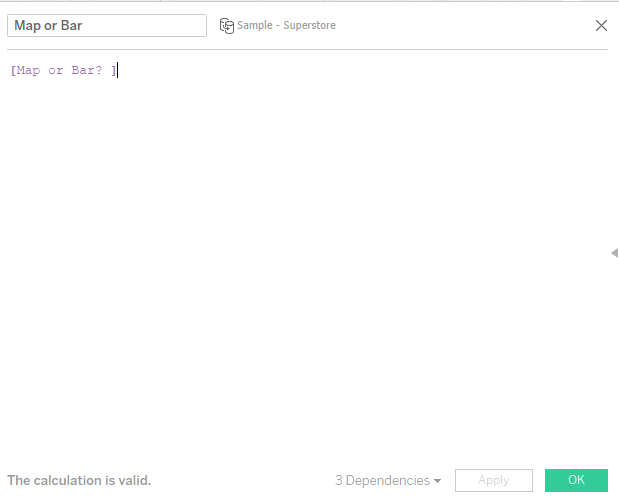
Create a new calculated field. All we need to do is drag the parameter we just made in the last step into the calculation window. Here’s how it should look.
4. Filter the charts
Now go to one of the charts we made. Let’s do the map first.
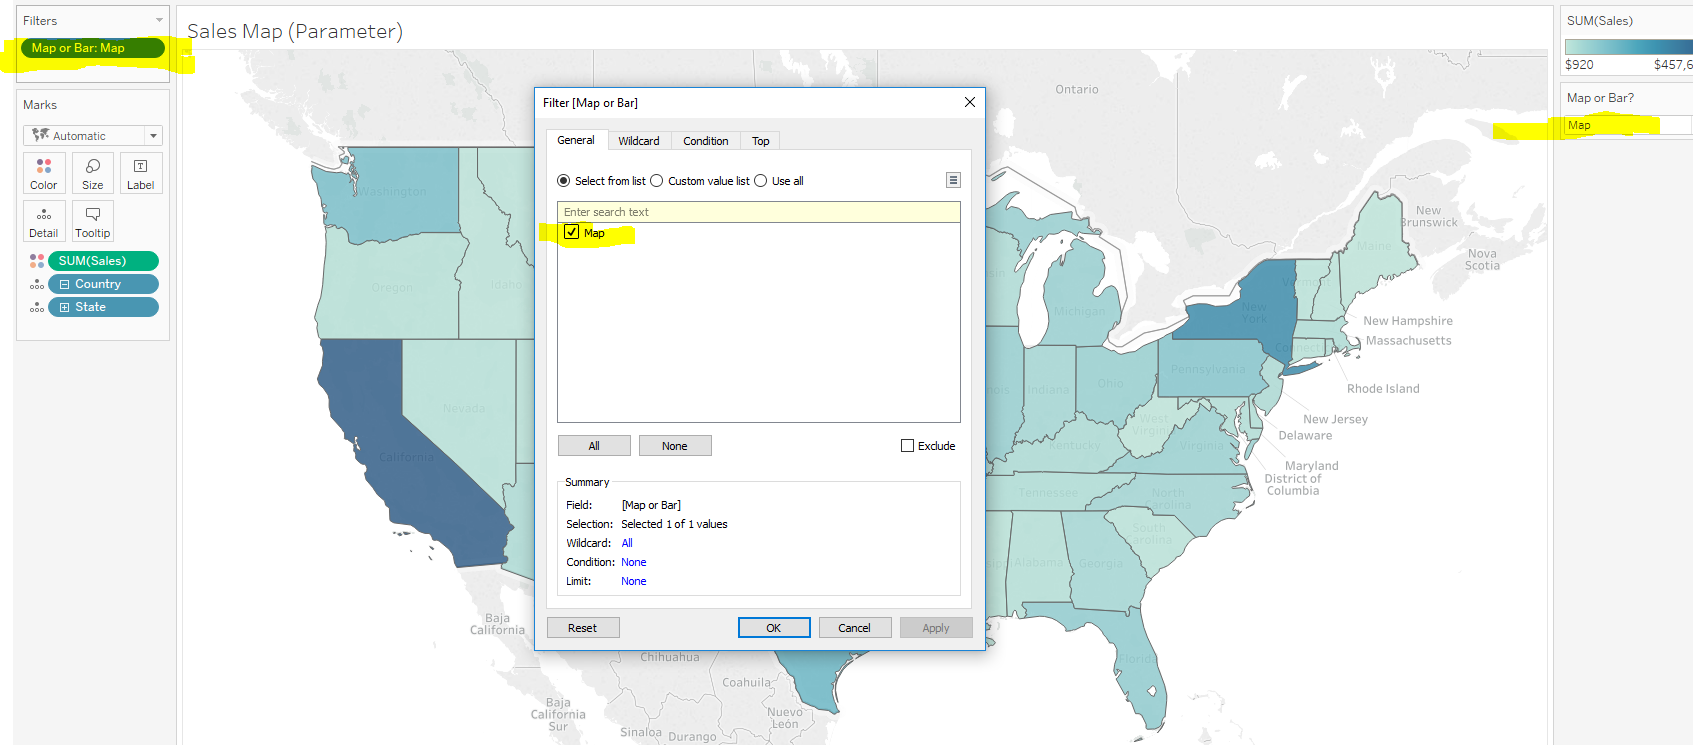
- On the parameter control pan – set the parameter to ‘Map’
- Now drag on the calculated field we just made to the filter pane
- You should only see a check box for Map – tick this. (If this is showing bar then you need to change the parameter control to ‘Map’)
- The set up should be something like this:
Now repeat the steps for the bar chart – But first change the parameter control to the bar chart.
The key point to note here is that whatever value is selected in the parameter will be the only value available to select in the filter – as we linked this parameter to the view using the calculated field. If for some reason you get an unexpected value appearing in the filter – check the parameter control settings to see what is selected.
5. Build the Dashboard
Now is time to put everything we’ve just made together into a dashboard.
- Open a new dashboard.
- Drag in a vertical container (or horizontal)
- Drag in one of the charts into the container – make sure it sits within the container. You’ll notice this with a blue box surrounding the edges of the container when you drag the sheet in
- Now comes the important bit!
- Drag your other sheet into the same container. For this to work both sheets must sit within the container. When you drag the second chart in then you’ll see a blue bar surrounding the container and a shadow at the base of the container to show you it’s in the right spot – it should look like this:
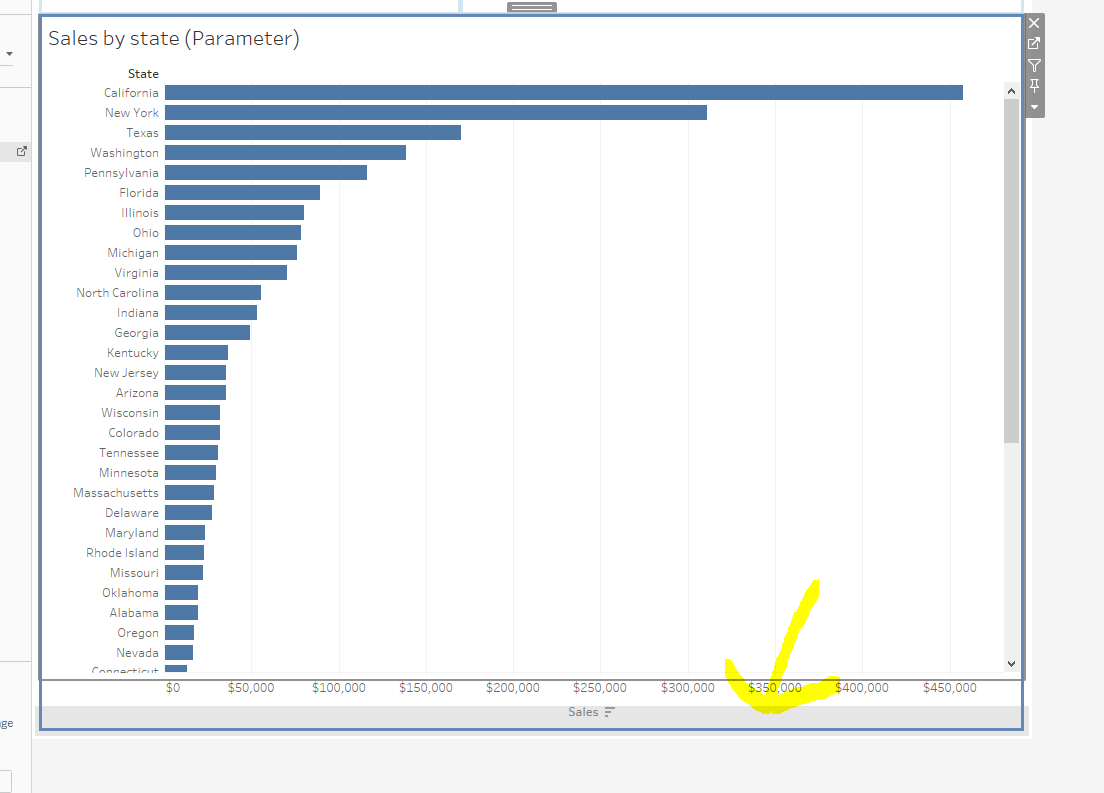
- Once both sheets are in the container you should now just see whichever of the charts is selected in the parameter control – which should have magically appeared in the top right of the dashboard.
- Hide both of the chart titles to clean up the view.
- Play around with the parameter – whenever you switch the parameter control you should see a different chart type.
Extra tip
If you want to make a dynamic title to go along with your switchable charts here’s how. Open up a text box and click ‘Insert’. Now look to the bottom of the drop down menu and you should see the parameter you made. Select the parameter and then you will see that in the text box. This part of text will show whatever is selected in the parameter control. Structure your title text around this and you’ll have a lovely dynamic title to go with your charts.
DONE!
Well done – you’ve just built a parameter to let your user to switch between chart types in a dashboards. Any questions or feedback please get in touch through linkedin or twitter.
