Viz in Tooltips are here – how can they help you and things to be wary of
If you’re sat there with your shiny new version of Tableau 10.5 open in front of you, you may have heard of Viz in Tooltips. Let me take you through a whistle stop guide on what they are and how you can use them effectively to improve your dashboards, whilst also pointing out some things you should be aware of before using them.
What are they?
Essentially, they are a chart within a chart. It means when we hover over a certain field – be that a segment of a bar chart or an area on a map – we can see a chart specifically related to this field but for another measure/dimension. Note: They also can have a wider range of uses, but this is how I have found them most useful so far!
Let’s start by opening the good old Superstore dataset in Tableau. I want to make a map showing the sum of Profit overall by state, with a line chart showing profit over time for each state. Now imagine this was all be combined without Viz in Tooltips on one, easy to manage dashboard. Tricky to see how to fit it all in isn’t it? We could use the map as a filter and by clicking or highlighting on the state on the map, select the desired line chart. However, let’s see how using Viz in Tooltips can help us.
1. Firstly, make yourself a nice, pretty map. Everyone loves a map.
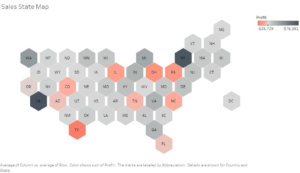
Here I have used a tile map, however if you don’t know how to create one, don’t worry as it’s not important for what we’re doing here. Make a standard area map if you prefer, or read this useful blog post from sirvizalot (Matt Chambers) on how to make a tile map here.
For this map, I have used SUM(Profit) for our colour and used a simple Red-Black diverging colour palette. You could use any measure you like here for the map, so pick something else if that interests you more. For this blog post, we are looking at how Viz in Tooltips can help further enhance the usefulness of our dashboards.
2. Build a line chart
So, onto our next chart. I have built a line chart showing Sum of profit over time. Once again you can chose any measure you like here, the crucial part is that it is a chart that can be easily filtered by state.
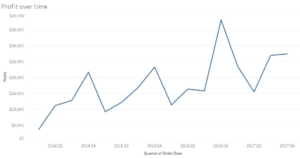
Here it is, a nice and simple line chart for ALL states. Don’t filter the chart now, this is what Viz in Tooltips will kindly do for us. What you should do now is fix the X axis so that all the charts when filtered remain the same width. If you like you can do the same for the Y axis, however with the vast differences in profits within states, I have chosen to keep this variable and just take note of it when comparing between states.
3. Make the tooltips
Now for the fun part! Let’s make ourselves a map where we can combine these two charts. It’s all pretty simple really, just head on over to the original map you made (you could duplicate this if you like) and click on tooltip. Use the <State> field as the title of the tooltip and then go to insert, sheets, and select the line chart:
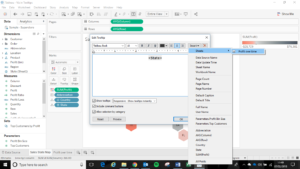
The resulting edit tooltip box should look something like this:
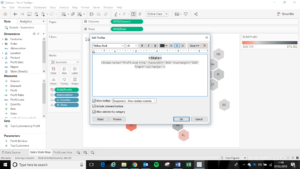
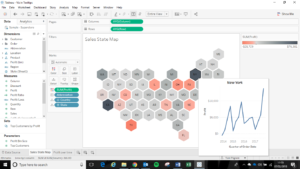
Click OK, then have a play around with the new map, when you hover over a state you should see a display something like this:
How does this help us/the user?
Simply put, it allows you to show a deeper level of understand and analytic content, whilst still keeping a clean and simple chart/dashboard. You can have a ‘larger’ picture view in a geographical map like we have done here with profit overall and add an extra element such as profit over time. This means that our user can see instantly what the overall picture is of profit by state, and if they wish to they can drill down to another level of detail instantly through the same view. This saves us both space and time. By hovering over major outliers, we can see what is causing that severe difference from the mean, was it one particularly good or bad year? Or are they a consistently good/poor performer?
What to be aware of?
It is easy now to get carried away with the new Viz in Tooltips feature, and rightly so. When used correctly they can be of great value. What you must ask yourself is why? Why am I doing this? Do I need to do this, or will a simpler version work as effectively? You must remember that the main chart is what most people viewing your viz will look at and will not hover over the interactive version and explore the data for themselves. Let alone know that they have the option to do so! You must be sure that you are not hiding away key information to your message in tooltips. They are an added extra, not the main viz!
Conclusion
Used properly, Viz in Tooltips can be a great way to add an extra layer of detail to your viz whilst keeping a simple and clean look. However, they must not form the main component of it, as you could lose key points in your message to your viewers.
Go and have a play around with them yourself and see how you could add another level to your viz or try and integrate a viz you have already made with two charts using Viz in Tooltips.
Hope you enjoyed the post and learnt something useful. Feel free to reach out on the usual channels. Twitter & Linkedin.
