


Using window_something calculations in Tableau took me a long time to wrap my head around. This blog is here to help anyone else who might need a push in the right direction to begin understanding them too.
In essence, window_anything looks at the data that underlies what is being shown on the screen. If you imagine your bar chart as a table, window_command will be referring to that when a calculation is made with it.
The easiest one to understand (in my mind) is Window_max. The difference from the normal max() command cannot be understated.
Here, I have three different metrics shown:
Max(Sales)
Sum(Sales)
Windowmax(Max(Sales))
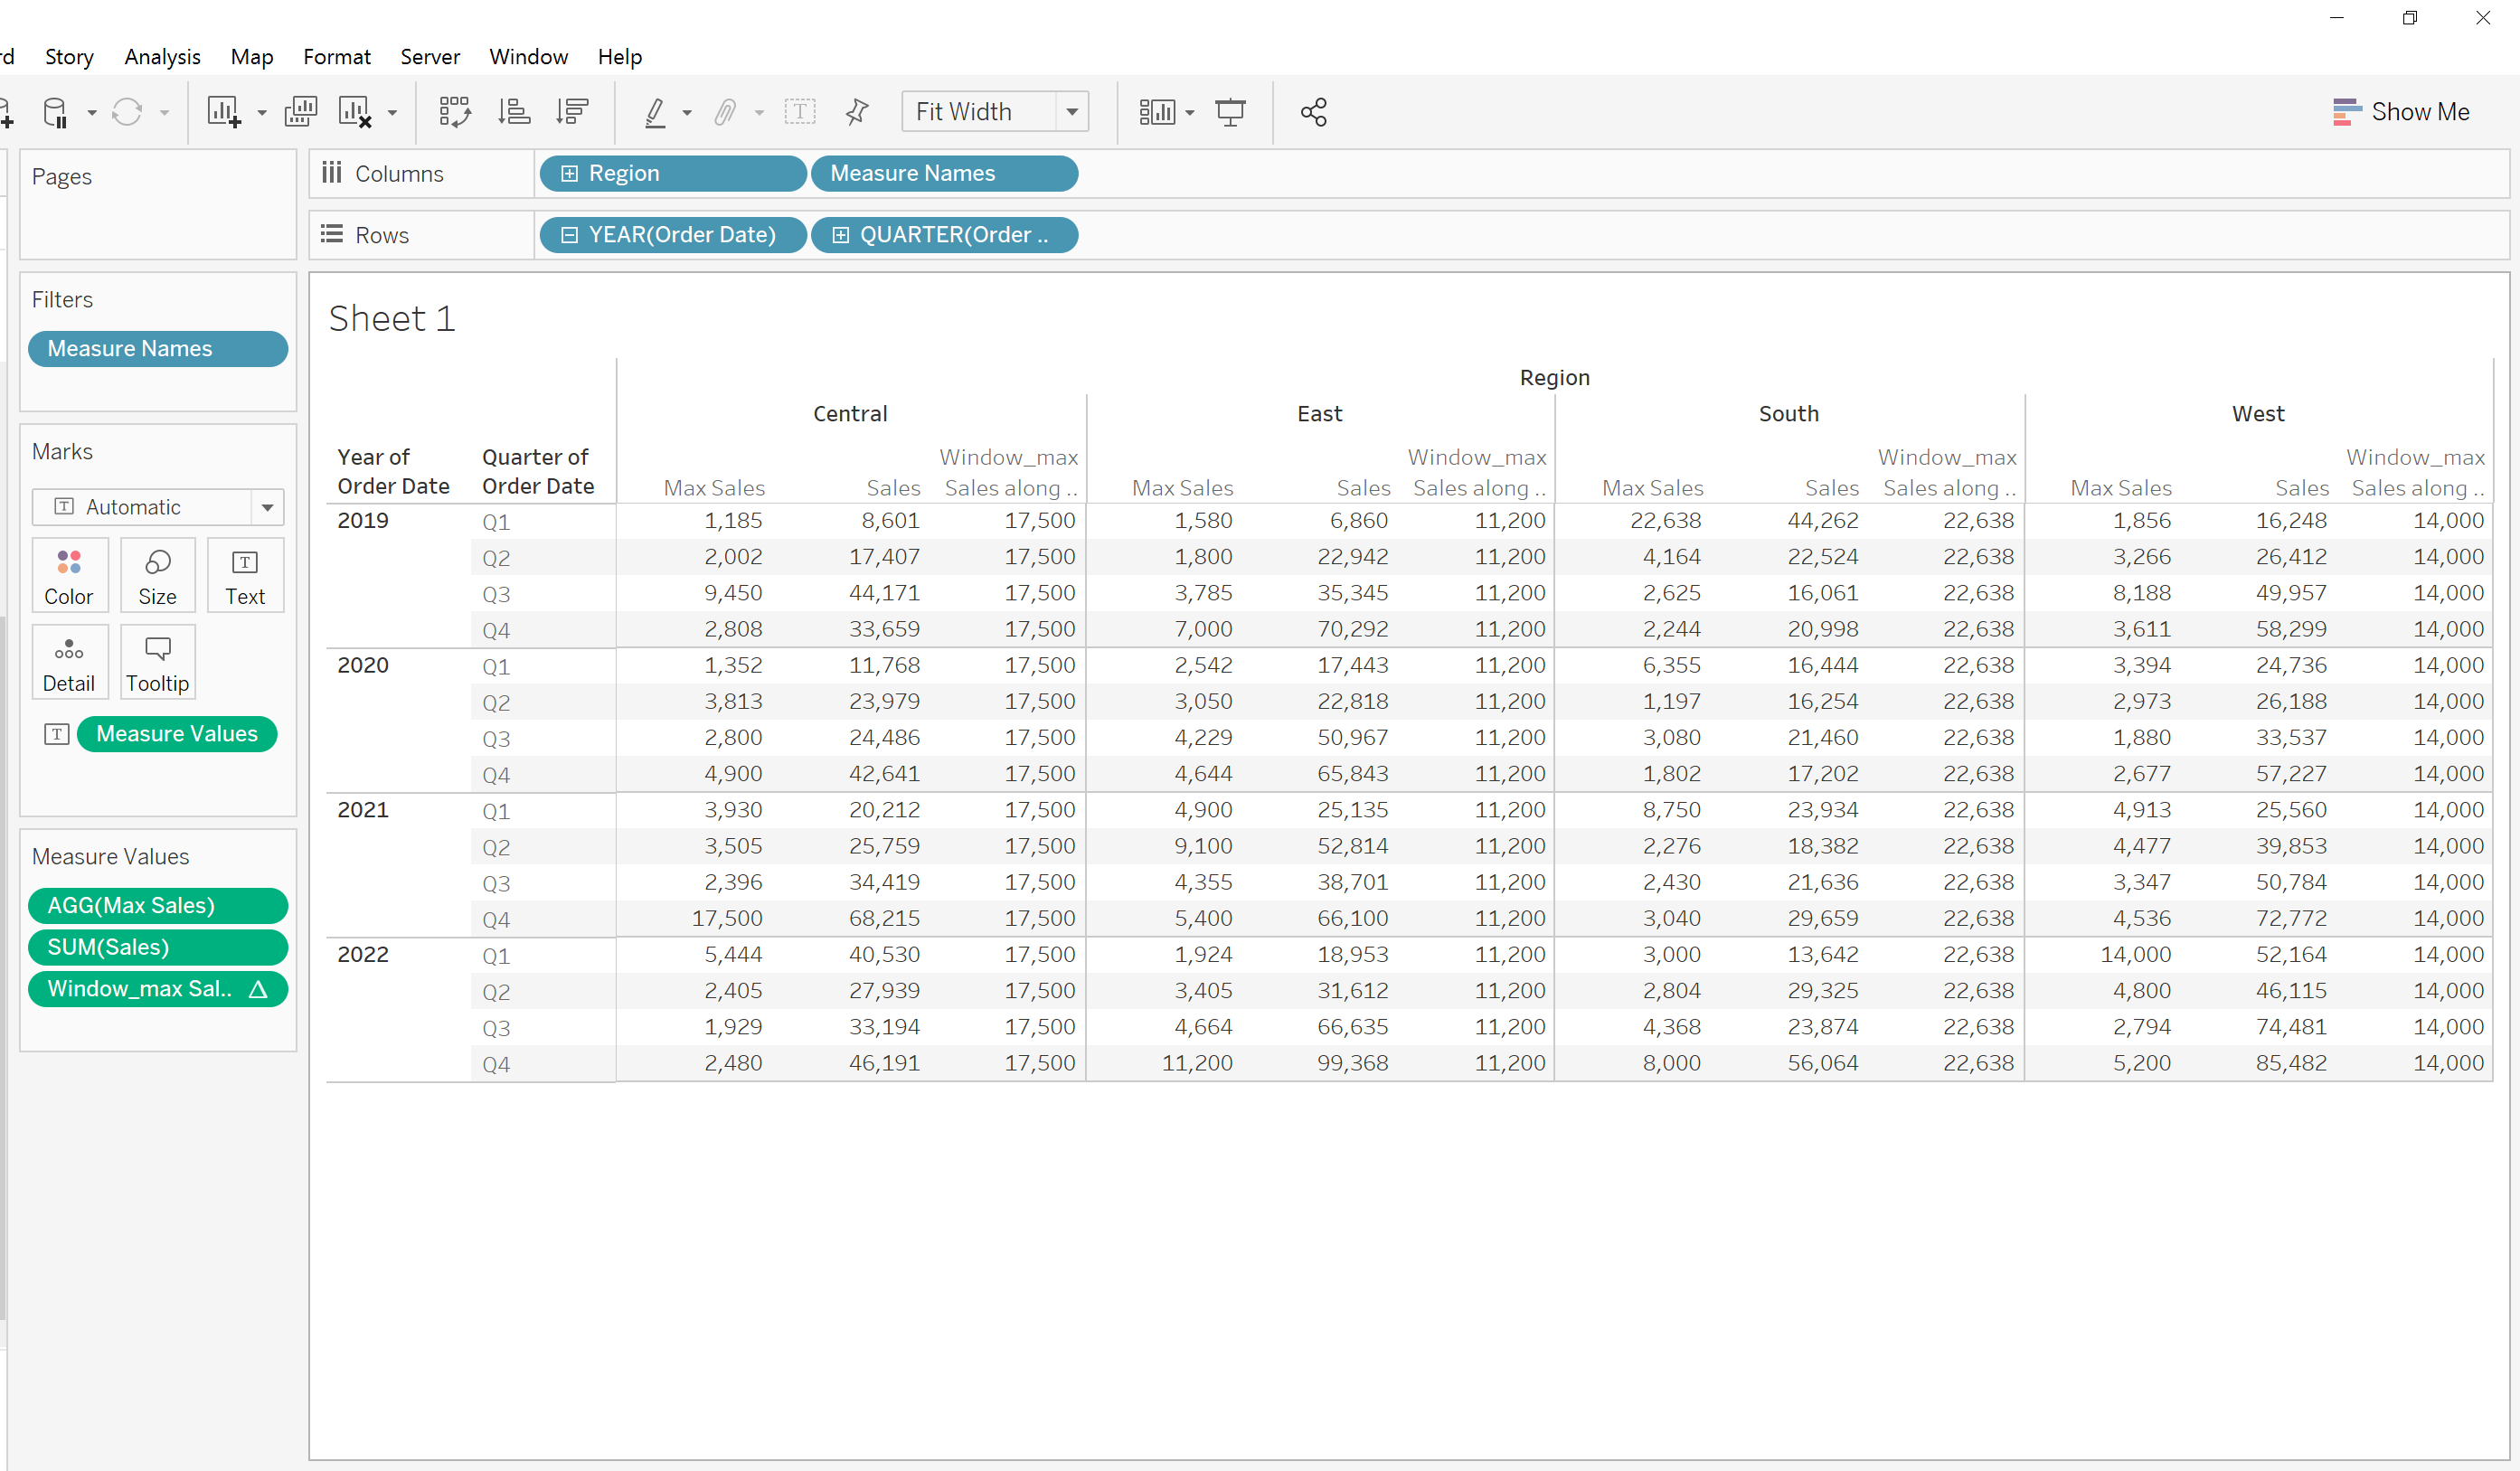
Here you can see how the different forms of max and sales contribute to the table above. If we start with the lowest values, we can see that max sales are taken as the maximum individual sale in each region in each quarter. next to this, we can see that sum sales shows the total sales in each region in each quarter. Window_max(max(sales)) takes the maximum of these max(sales) and creates a whole column with the maximum individual value in that region across the entire timeline.
You can change how the values for this are calculated. If you right click on the calculated field you can change how the table calculation is computed. as default it is table down, which is shown in the picture above. However, you can change this to table across, by pane, which in this case would be a year of a specific region (east in 2019 all come up as 7000), or by a specific dimension. These all yield different results.
Beyond this, all window_commands use the same principle. It is whatever is shown in the view (the window....), and then how you choose to compute that.
For anyone who has read this and has realized that it hasn't helped much, I would recommend one thing. Simply choose a dataset that you understand, whether that is something you are currently working on or superstore data, make a cross-tab or table, and simply play around with the window commands as I have above. Simply by putting max(sales) and then window_max(max(sales)) looking at the numbers for a bit it allows you to see how the calculation works and how it thinks, and as soon as you start realizing that you start understanding it.