


A simple solution to a complex problem.
I had a simple problem to solve.
I had to visualize the revenue of a product category at a yearly and monthly level.
I decided to visualize the last N month of my year ( excluding the current month)
and the last 31 days of the prior month.
Since the logic for the 2 calculations was different and i was not able to change date aggregation easily ,I found the following solution.
Let's make it more practical and clear.
For the Prior Month view... if the present month when viewing the dashboard is June you will get a daily breakdown of sales in May.
For the YTD view... if the present month when viewing the dashboard is June you will get a monthly breakdown of sales from January to May .
If you immediately visualize the data you will notice that you cannot change the date aggregation level natively ( you have to decide the breakdown level that you want and keep it for all the cases.
Since I was switching From the "YTD" view and the "Prior Month" view with a parameter I decide to change the level of aggregation of my dates. I will show you how to achieve this since it can be really useful especially if you want to add more context and insight to your view.
Step 1 : Create a Parameter that will drive the switch
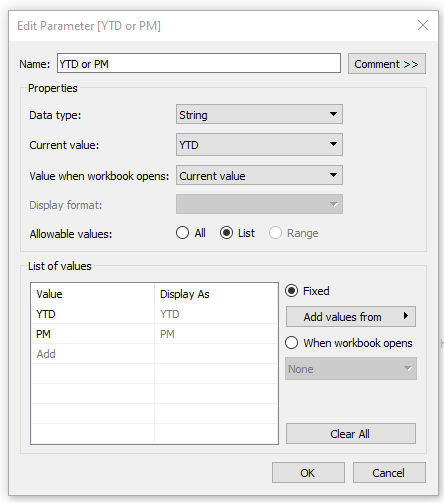
The Parameter needs to be a string, and in my case, I have inserted 2 values.
YTD for the Year To date and PM for the Previous Month.
Step 2 : The Calculations
This will be the calculation for the Prior Month Sales. Since my version of is not including 2022 data i have calculated the month in the dateadd expression as 13, if you have updated data it will be a simple -1
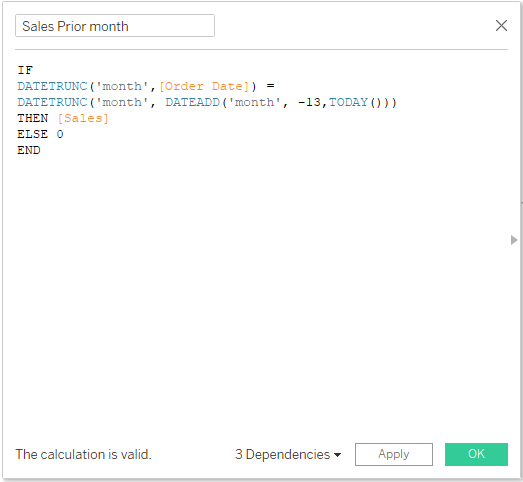
IF
DATETRUNC('month',[Order Date]) =
DATETRUNC('month', DATEADD('month', -1,TODAY()))
THEN [Sales]
ELSE 0
END
This is the Calculation for the YTD without the actual month ( goes back to 2021).
If you have updated data you will have to change the 1 in the second expression with a 0.
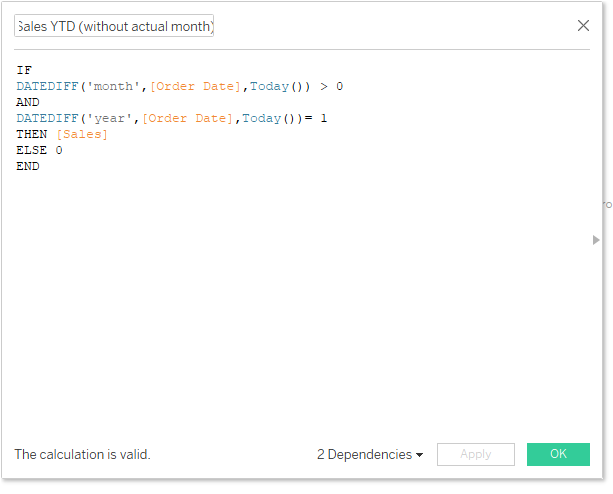
IF
DATEDIFF('month',[Order Date],Today()) > 0
AND
DATEDIFF('year',[Order Date],Today())= 0
THEN [Sales]
ELSE 0
END
Step 3 : Swap Calculation
This calculation will swap your measure to YTD and PM level.
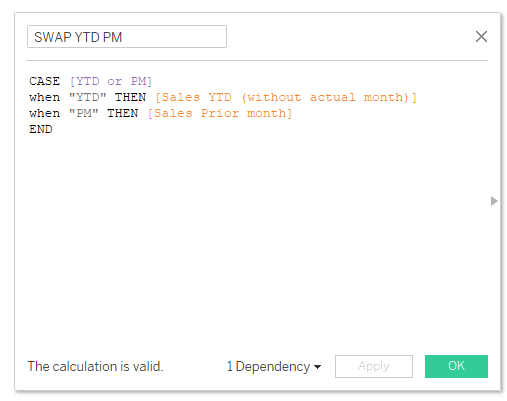
CASE [YTD or PM]
when "YTD" THEN [Sales YTD (without actual month)]
when "PM" THEN [Sales Prior month]
END
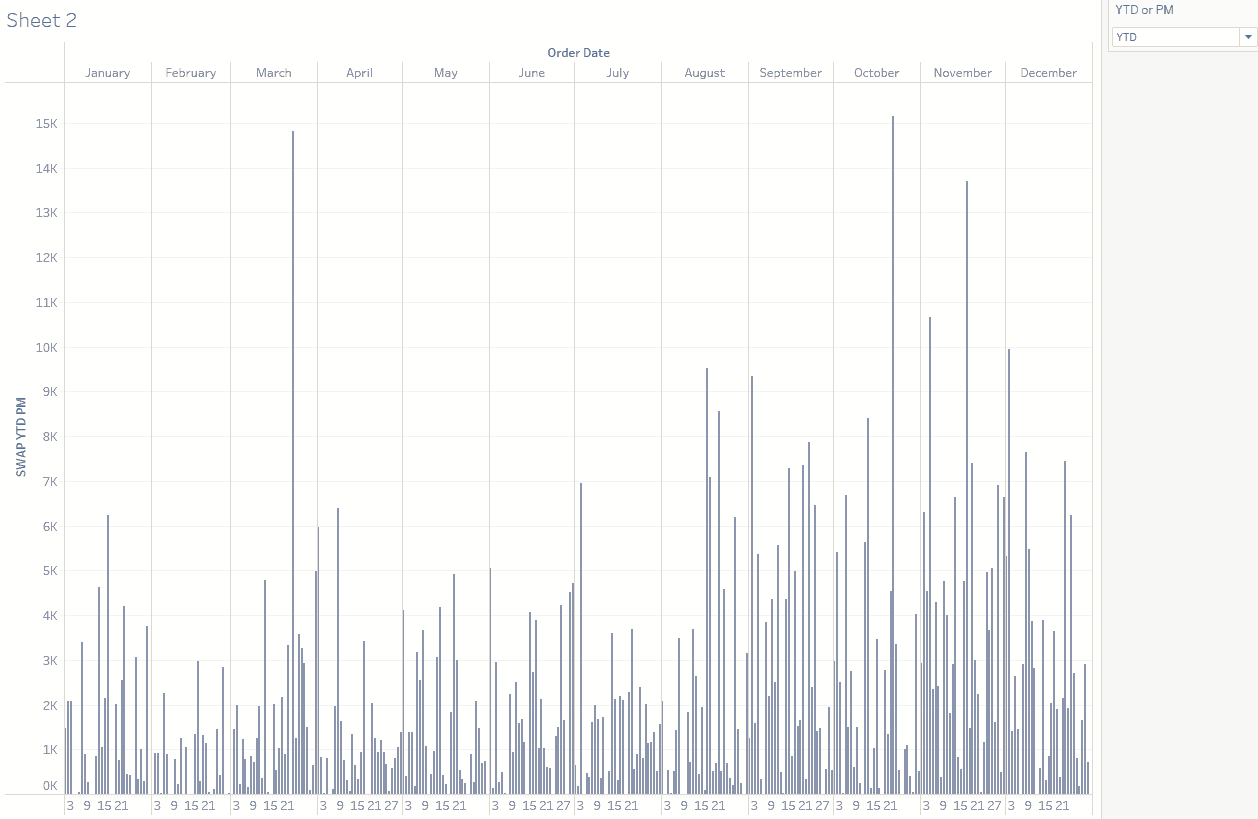
At this point, if you drag in the view the Order Date this is what you will see
Step 4 : The Final Calc.
This is what you will need To fix the problem
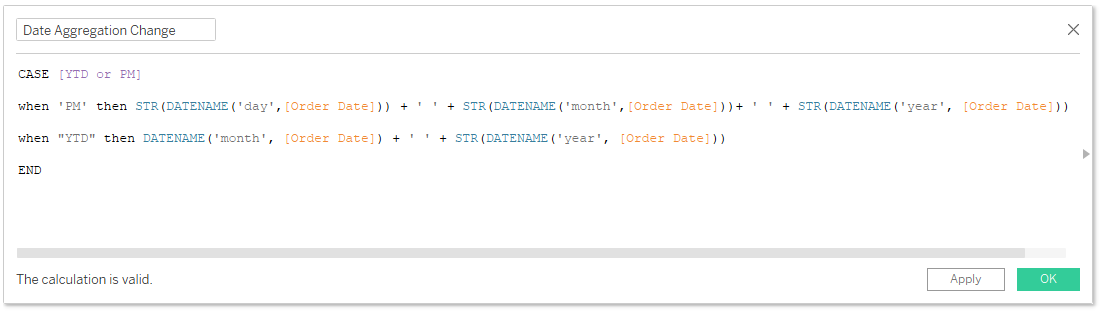
This calculation will create a list of strings that will be also correctly formatted in order to visualize them properly in your sheet.
You can use this list like a normal date.
In this case, I am using 2 expressions for YTD and Month, but there are multiple cases that you can use.
This is the complete calculation if you want to use it!
CASE [YTD or PM]
when "day" then LEFT(STR(DATENAME('day',[Order Date])),3) + ' ' + STR(DATENAME('month',[Order Date]))+ ' ' + STR(DATENAME('year', [Order Date]))
when "Last 30 Days" then LEFT(STR(DATENAME('day',[Order Date])),3) + ' ' + STR(DATENAME('month',[Order Date]))+ ' ' + STR(DATENAME('year', [Order Date]))
when "week" then LEFT(STR(DATENAME('day',[Order Date])),3) + ' ' + STR(DATENAME('month',[Order Date]))+ ' ' + STR(DATENAME('year', [Order Date]))
when 'month' then STR(DATENAME('day',[Order Date])) + ' ' + STR(DATENAME('month',[Order Date]))+ ' ' + STR(DATENAME('year', [Order Date]))
when "quarter" then 'Week ' + DATENAME('week', [Order Date]) + ' ' + STR(DATENAME('year', [Order Date]))
when "year" then DATENAME('month', [Order Date]) + ' ' + STR(DATENAME('year', [Order Date]))
END
IMPORTANT
Since this calculation is giving a list of String format dates, you need to sort them out by order date in this way.
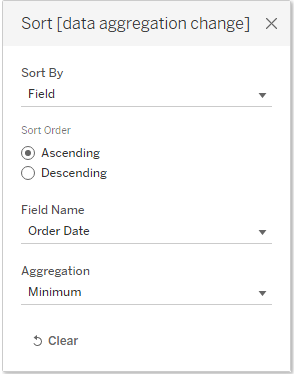
Otherwise, your "dates" will be alphabetically ordered by the name of the month and not chronologically.
Final Step: The filter
After the calculation, we need to filter all the results to the same date level that you want to see in the sheet.
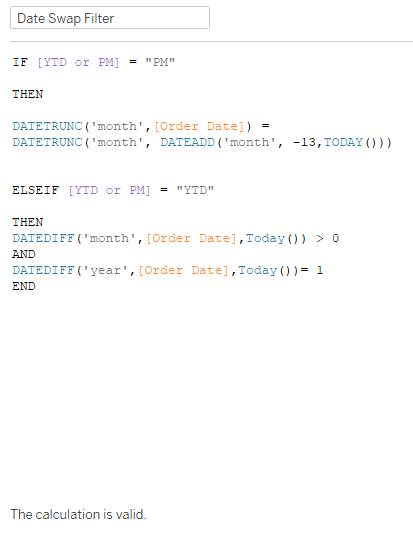
This is the one to use if you have updated data.
IF [YTD or PM] = "PM"
THEN
DATETRUNC('month',[Order Date]) =
DATETRUNC('month', DATEADD('month', -1,TODAY()))
ELSEIF [YTD or PM] = "YTD"
THEN
DATEDIFF('month',[Order Date],Today()) > 0
AND
DATEDIFF('year',[Order Date],Today())= 0
END
We are filtering our timeline to our dates of interest.
The result
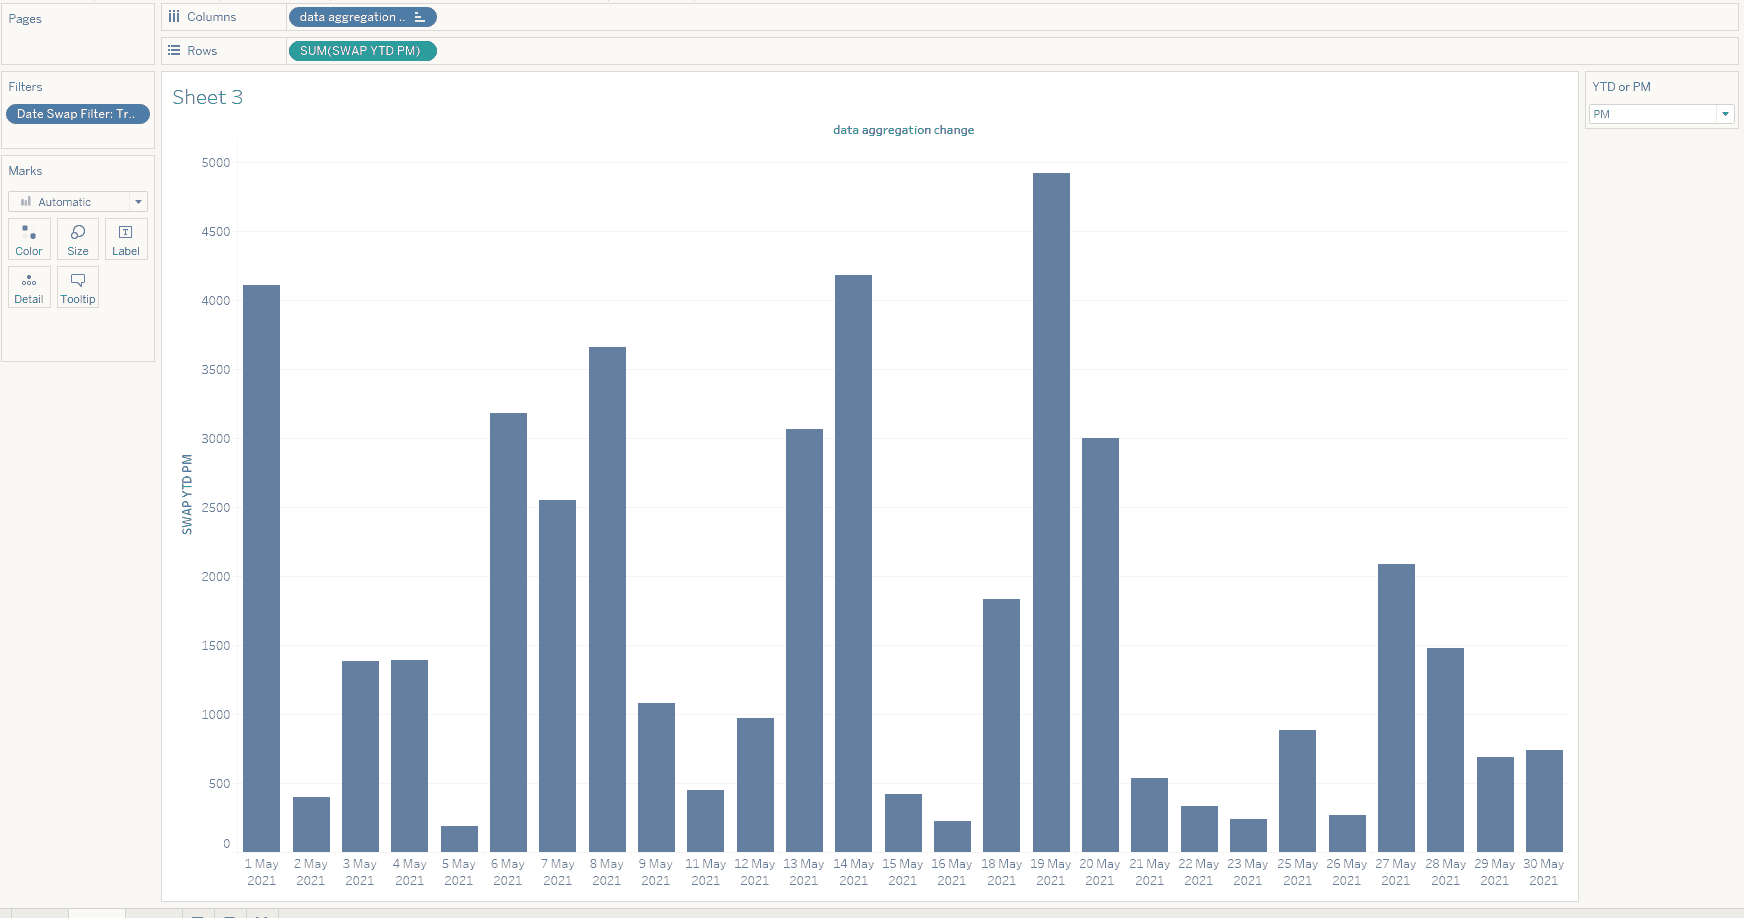
Et voila!
A beautiful daily breakdown for the prior month sales.and a monthly breakdown for the YTD sales.
What you will need to create ( recap)
- A parameter to switch between your date aggregation examples.
- Calculations for your fields based on the criteria that you need.
- Measure swap calculation.
- Date aggregation calculation and sort by order date.
- Date Swap filter
And that's it!
This is really useful, especially if you need to visualize the same data with different date calculations.