


A quick tip for Quick Viz in tooltip action!
Hi everyone!
I want to share with you a quick tip to keep in mind when you want to make a quick viz in the tooltip.
I was trying to count the number of orders for each client in a sheet and use that later as a Viz in Tooltip.
I noticed that tableau was automatically hiding all the days that did not have any orders.
This can be misleading, especially if you want to track the trend of the orders during your timeline.
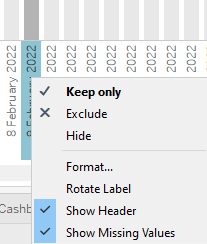
Simply right-click on your columns axis to show these values and activate "Show Missing Values". This will allow the tooltip to show the missing values in the range of your target days.
Just an example of my case.
I filtered only in July when my client ordered something on July 12th, 13th and 15th.
With "Show Empty Columns", the viz in tooltip was showing all the day of July with all the empty values (from 1st to 15th)
With "Show Missing Values", the viz in the tooltip remain focused on the excellent range of dates and only shows the days between the 12th and 15th of July, also showing the 14th of July.
Hope this quick tip will be useful for you...have a nice Viz in Tooltip!
Tommaso