


This blog walks through the project that implements a “live” connection between Tableau Pulse and the database where the data is stored.
We are simulating a "live" database connection by creating a system where data is updated regularly, allowing those changes to be reflected in Tableau Pulse metrics.
I say “live” in quotation marks because we are creating a setup where the database updates daily, and Tableau Pulse refreshes its connection to the database on a daily schedule as well. So it is “live” in the sense that the Pulse metrics update on a daily basis, matching the same frequency at which the underlying data is refreshed.
Step 1: Simulating a Live Database
The first step is to create a simulated live data environment using Snowflake. A Snowflake table is set up using Sample Superstore data and is updated daily. Each day, a random number of new order records is appended to the table, mimicking the behavior of a continuously updating production database.
This establishes the foundation for a dynamic dataset that changes over time.
Step 2: Publishing Data to Tableau Cloud
Once the Snowflake environment is in place, the next step is to bring the data into Tableau Cloud as a published data source. This allows Tableau Pulse to access the data and use it for metric creation.
To achieve this, a Tableau Prep flow is created in Tableau Cloud. The flow queries the Snowflake table on a scheduled basis and publishes the results as a data source in Tableau Cloud. The Prep flow is scheduled to run once per day, shortly after the Snowflake table has updated with new rows.
Step 3: Creating Tableau Pulse Metrics
With the data now available in Tableau Cloud as a published data source, the next step is to create Tableau Pulse metrics.
For this project, let’s look at Month-to-Date Sales as the primary metric. We can observe how the Pulse metric responds to new incoming data and determine whether connection between Snowflake and Tableau Cloud is set up correctly.
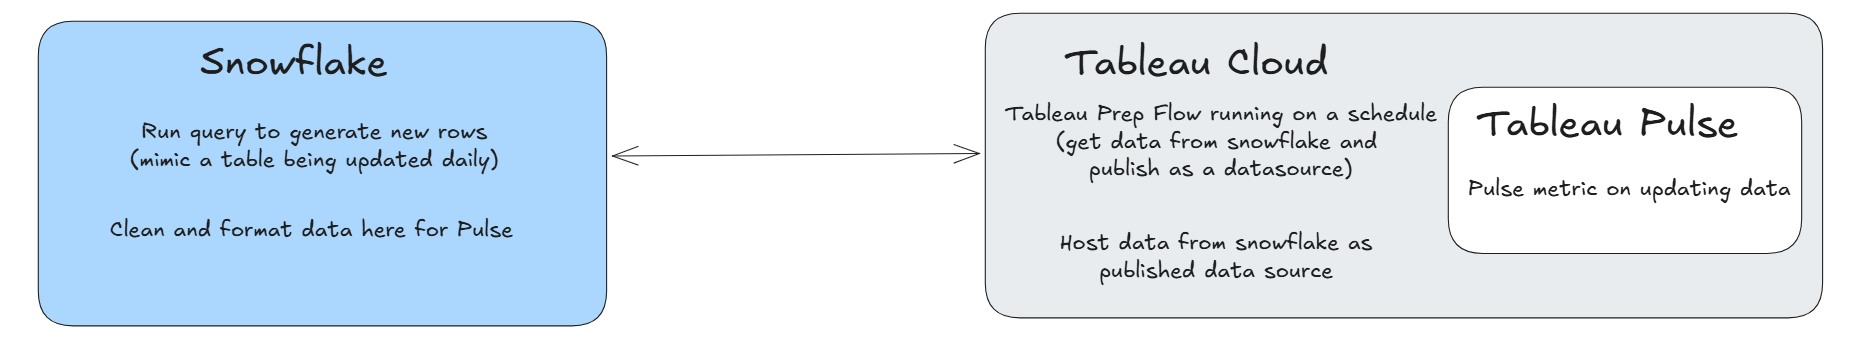
Overall, the diagram below shows how the connection between Snowflake and Tableau Pulse is established using Tableau Prep.
Testing the End-to-End Pipeline
Now that the overall architecture has been established, the next step is to test how the implementation performs in practice.
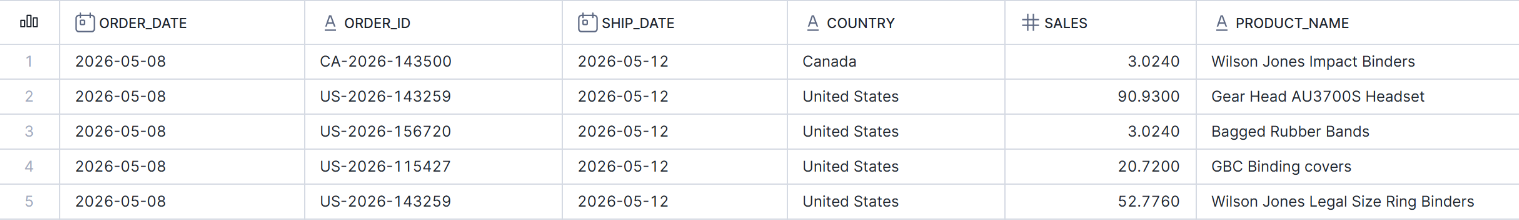
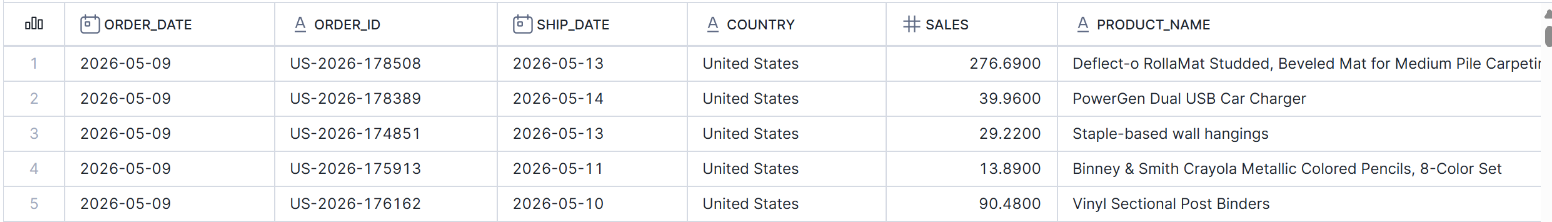
For this test, we are going to generate data between May 8 and May 11, 2026 to see if the Tableau Pulse metrics update correctly. Below shows part of the data in Snowflake going up to May 8, 2026.
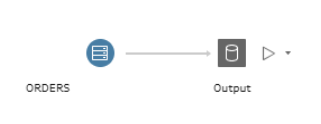
This data is then pulled into Tableau Cloud using the Tableau Prep flow on Cloud.
After this flow is run on Cloud, we can use the output to create the Tableau Pulse metric as seen below.
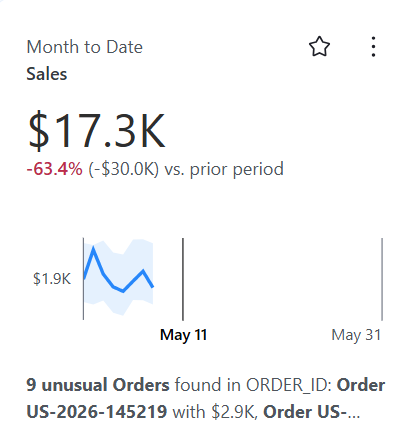
You can see that, because this test is being run on May 11, the line chart does not extend up to the current date, and there are three days of missing data.
Now we can test what happens when new data is generated for May 9 and observe whether the Tableau Pulse metric updates after the Tableau Prep flow refreshes the published data source.

You can see below that the metric successfully updated, and the forecast even started to appear.
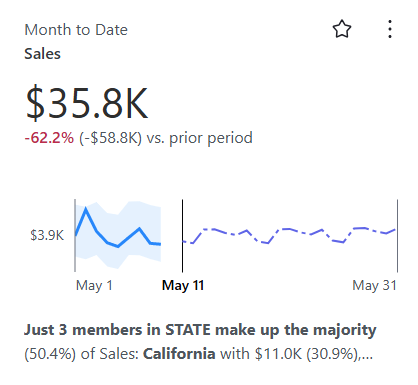
Tableau Pulse documentation notes that forecasts are calculated based on historical metric data and will only appear on the overview chart when Tableau Pulse is confident in the forecast. This behavior aligns with what we observed here. Initially, the missing three days of data leading up to the forecast window reduced confidence in the model. However, as more recent historical data was added and the dataset became more complete up to the current date, forecast confidence increased and the prediction began to appear.
Great! Next, we’ll generate data up until the day before the current date, and then set up a schedule in Snowflake to generate each day’s data on a daily basis.
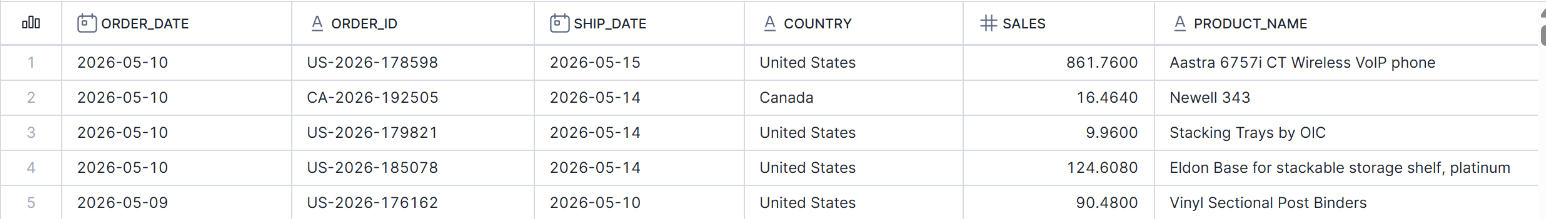
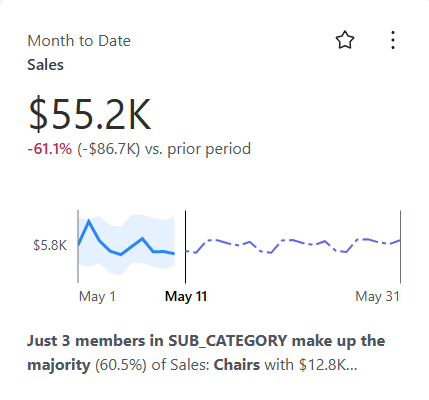
Here is what the data and the Tableau Pulse metric look like with data up to May 10.
With the data and Tableau Pulse metric now updated through the day before the current date, the next step is to set up a schedule in Snowflake to automatically generate new rows for the current date on a daily basis.
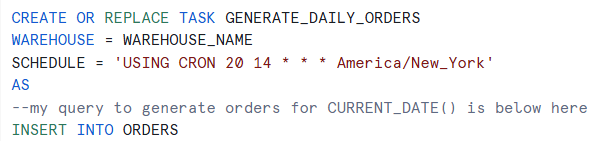
For this, we can use a Snowflake Task, which allows us to schedule a SQL query to run on a recurring basis within Snowflake.
Here, we create the Snowflake Task to run the query that generates the new rows.
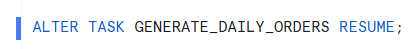
And then we execute (or resume) the Snowflake Task so it begins running on the defined schedule.
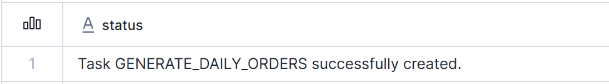
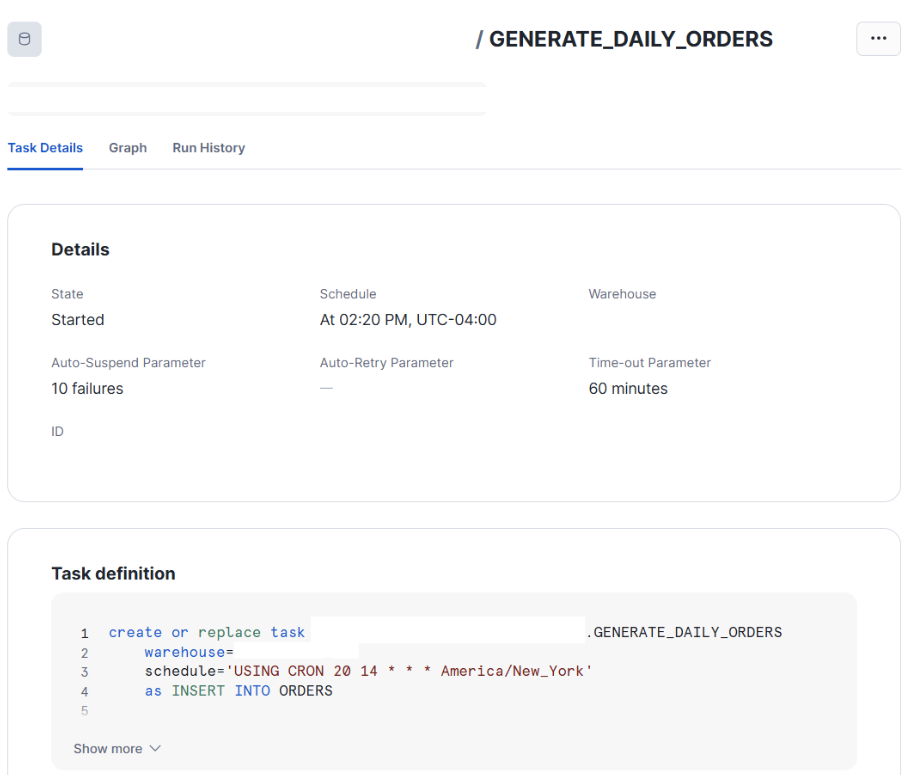
You can see below that our task has successfully started in Snowflake.
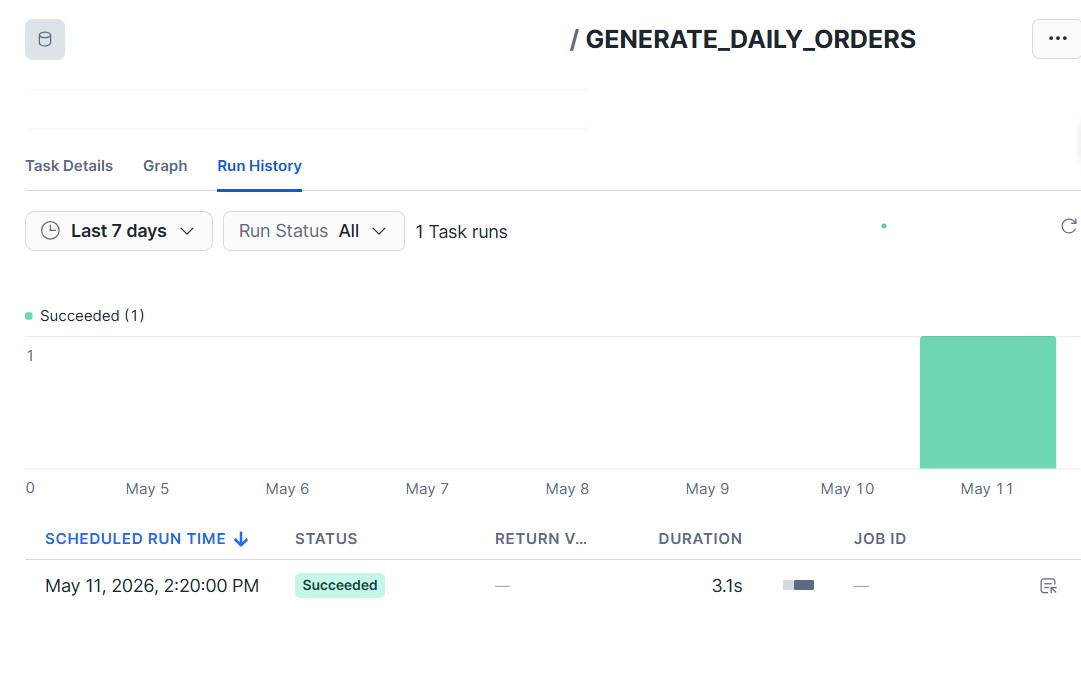
If we check the task history after 2:20 PM, we can see that it successfully ran.
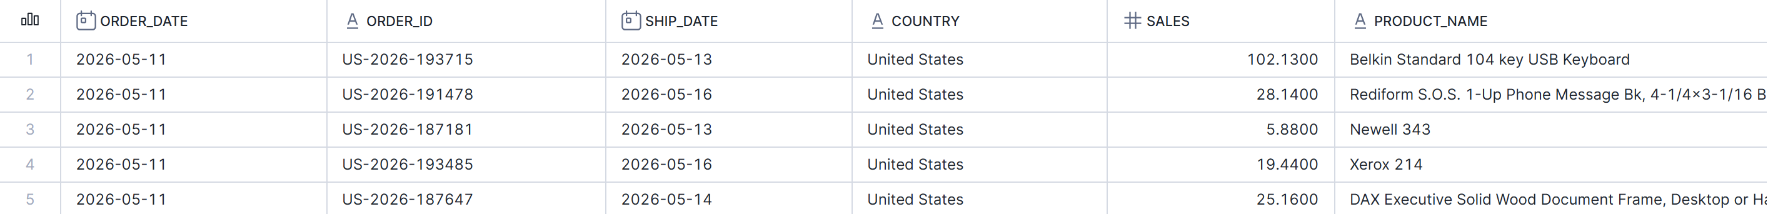
And if we check the table in Snowflake, we can see that new orders have been appended with the current date.
Now that we set up Snowflake to simulate an automatically updating database, we’ll set up Tableau Prep to automatically extract this new data on a schedule as well.
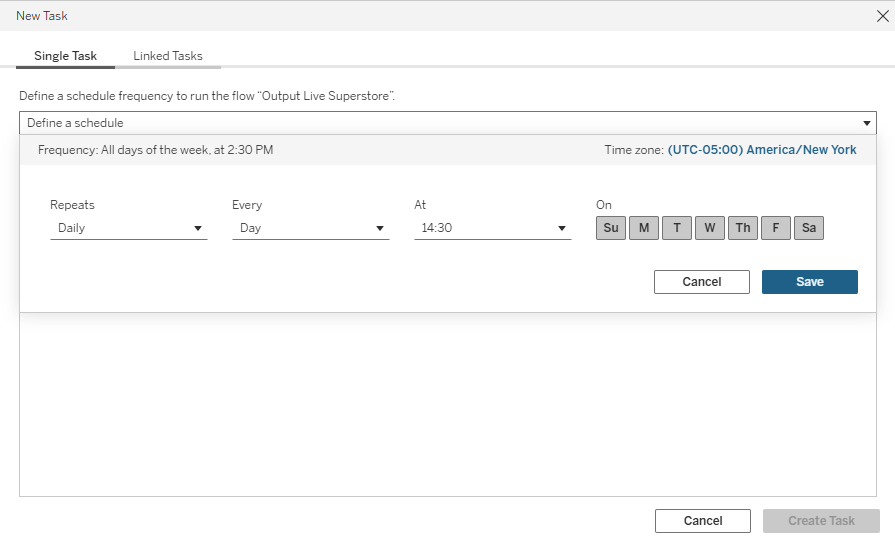
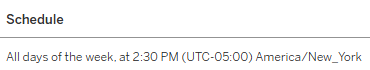
Below, we create a scheduled task for the Tableau Prep flow in Tableau Cloud to run every day at 2:30 PM.
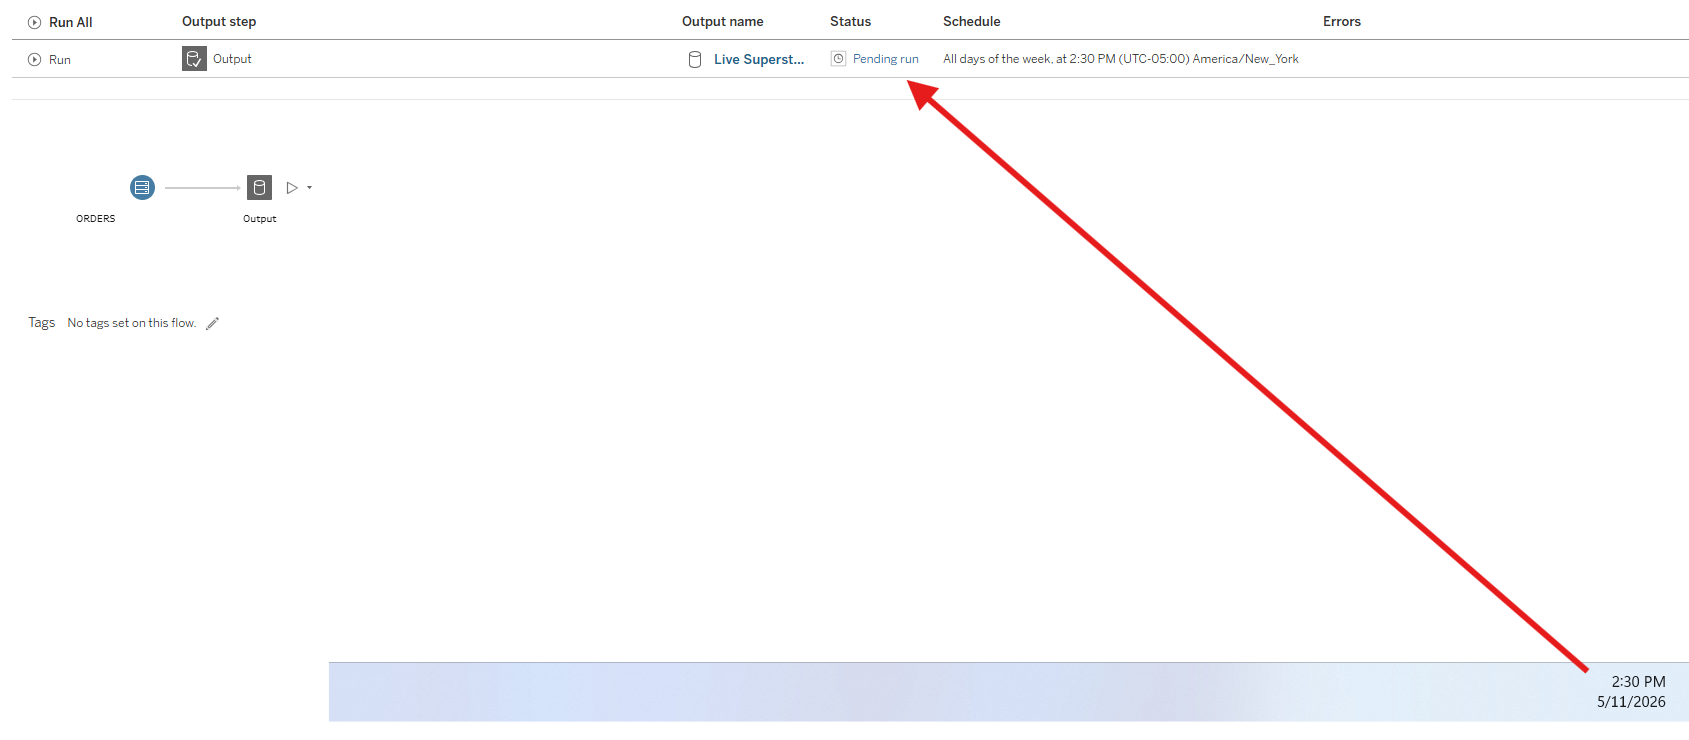
You can see that at 2:30 PM, the Tableau Prep flow begins its execution process in Tableau Cloud.
Status: Pending run
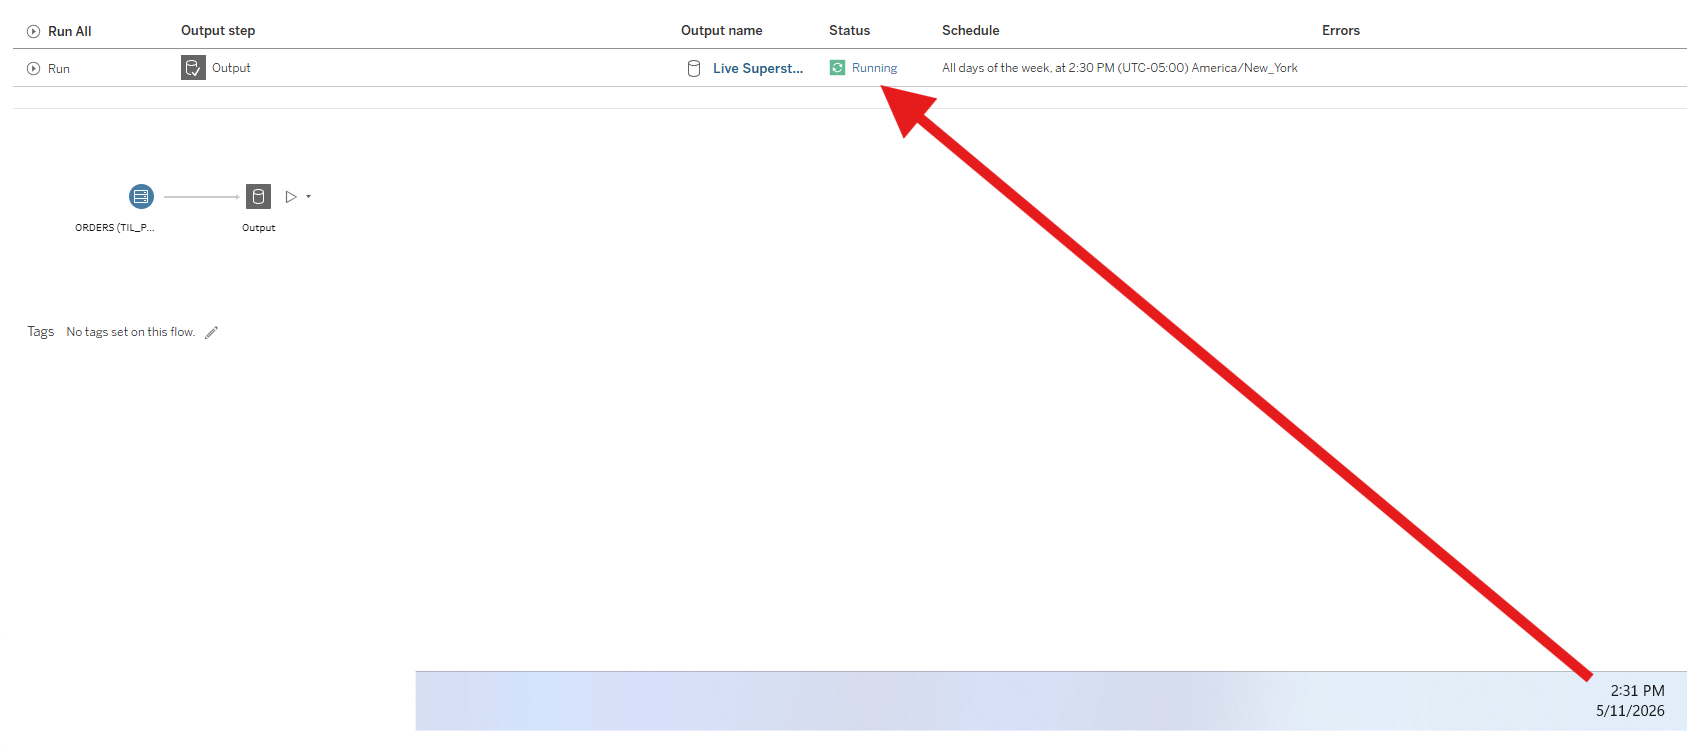
Status: Running
Status: Succeeded
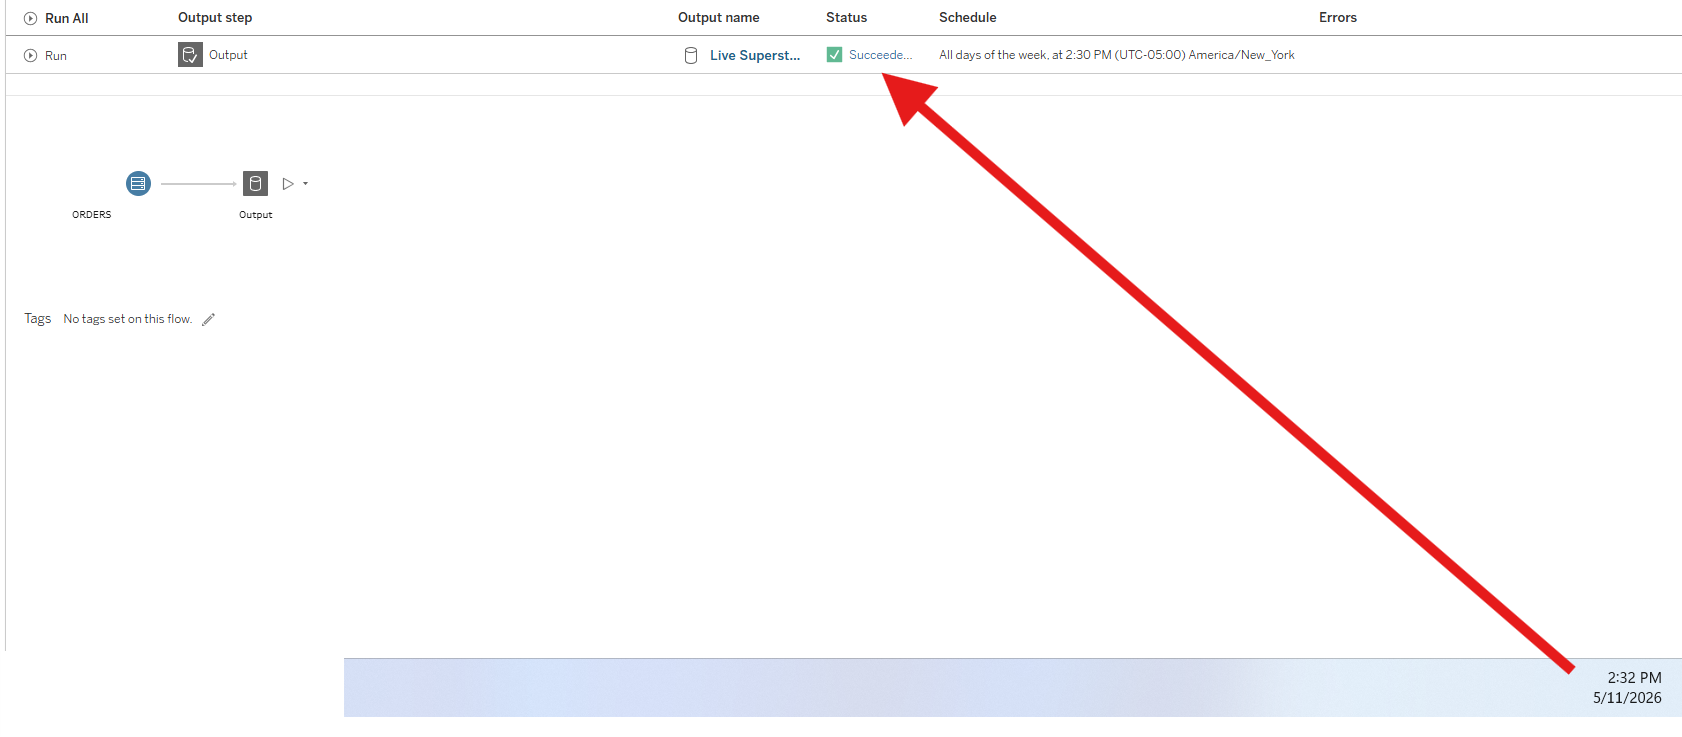
Now that the Tableau Prep flow status shows it ran successfully in Tableau Cloud, let’s check Tableau Pulse to see whether the metric has updated with the latest data.
You can see below that the line chart now extends to the current day, and the figures have updated accordingly in Tableau Pulse.
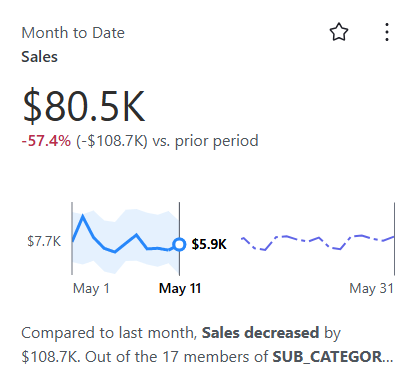
Thus, the full pipeline is now running on a schedule: the data in Snowflake is updated daily through a scheduled task, and the downstream Tableau Prep flow refreshes the published dataset at 2:30 PM each day. As a result, the Tableau Pulse metrics will now refresh automatically every day, reflecting the latest data without manual intervention.
Before we wrap up the project, we should disable the scheduled tasks to prevent unnecessary executions.
First, in Tableau Cloud, we can simply delete or disable the scheduled task associated with the Tableau Prep flow, which stops the automatic daily refresh of the published data source.
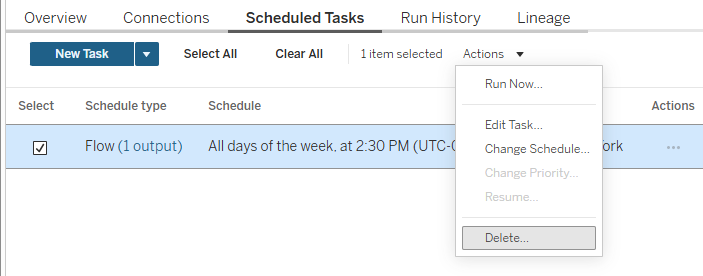
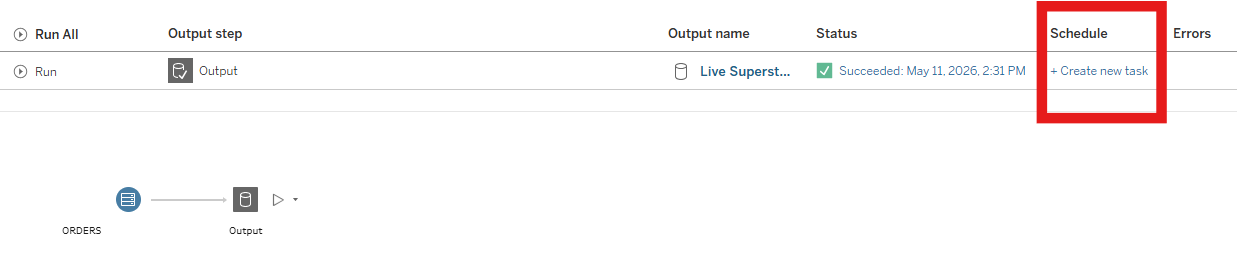
After that, you can see that the Prep flow is no longer associated with any schedules.
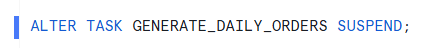
And in Snowflake, we can first suspend the task to stop any further scheduled executions.
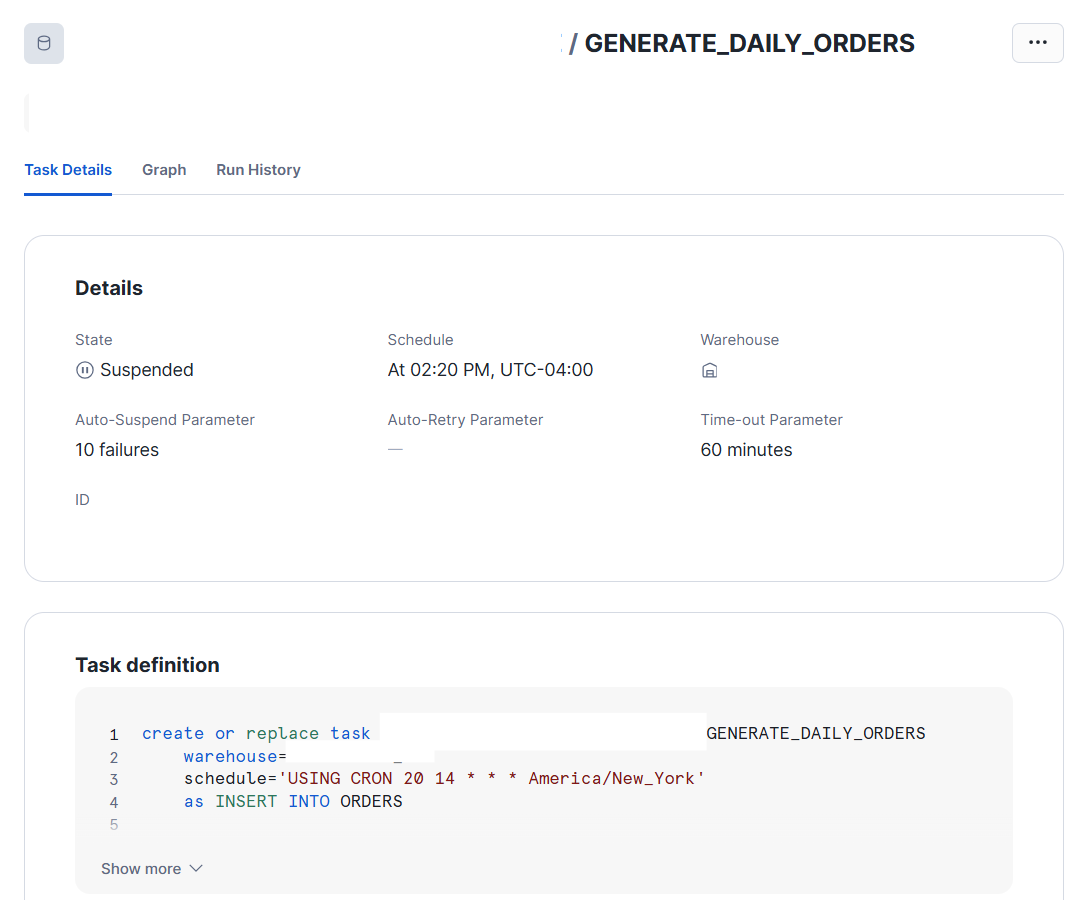
You can now see the task in Snowflake showing a suspended status, confirming that it is no longer actively running on a schedule.
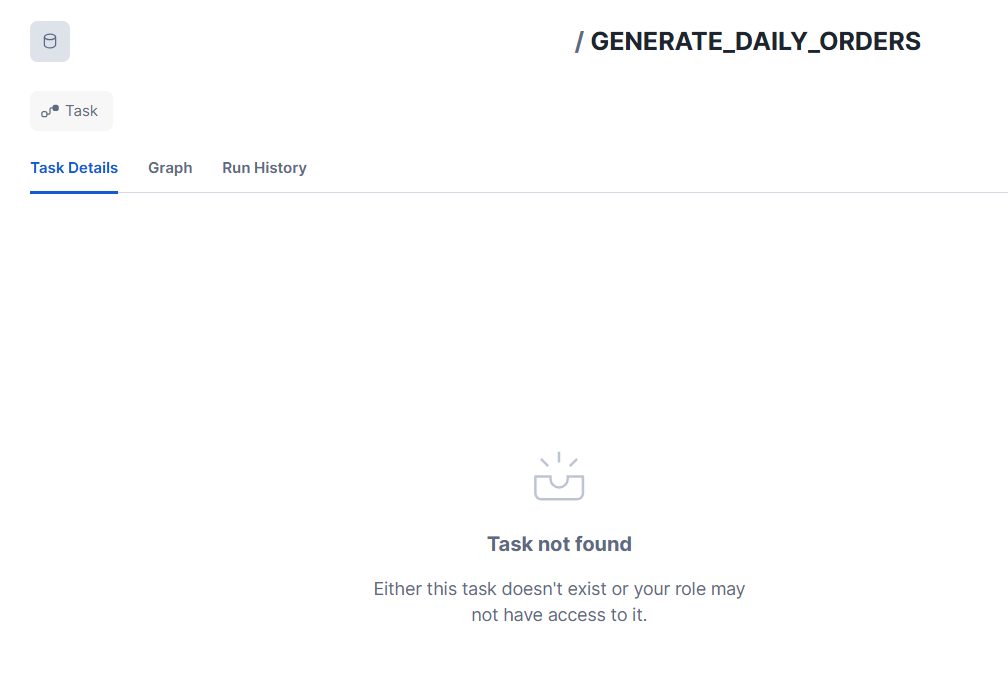
And finally, if we drop the task entirely in Snowflake, it is fully removed from the system, ensuring no further scheduled executions will occur.
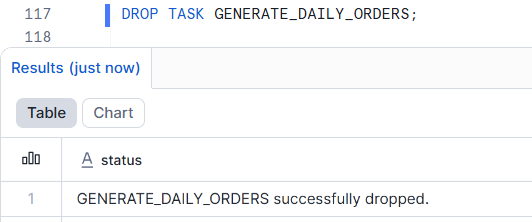
The task is now no longer part of the schema in Snowflake!
This was the end-to-end project demonstrating how to connect a live-updating database to Tableau Pulse. Using Tableau Prep is not the only way to update a published data source, but it is one of the simpler and more intuitive approaches for building and scheduling this type of pipeline.
Hopefully, this helped illustrate a practical way to set up a connection between your database and Tableau Pulse, and provided a clear view of how a simple scheduled pipeline can simulate a live analytics system.