Week 2 @ TIL. After having sessions with Martin, Carl and Lorna, our lovely coaches, we had a class with Andy, who shows me a whole new mindset of how to communicate effectively through data visualization. One of the most prevalent techniques used in data visualization is coloring. Communicating the right affect, a feeling, experience or emotion, is critical in creating engaging visual communication. As he said “color evokes emotions, create associations, and highlights key findings”.
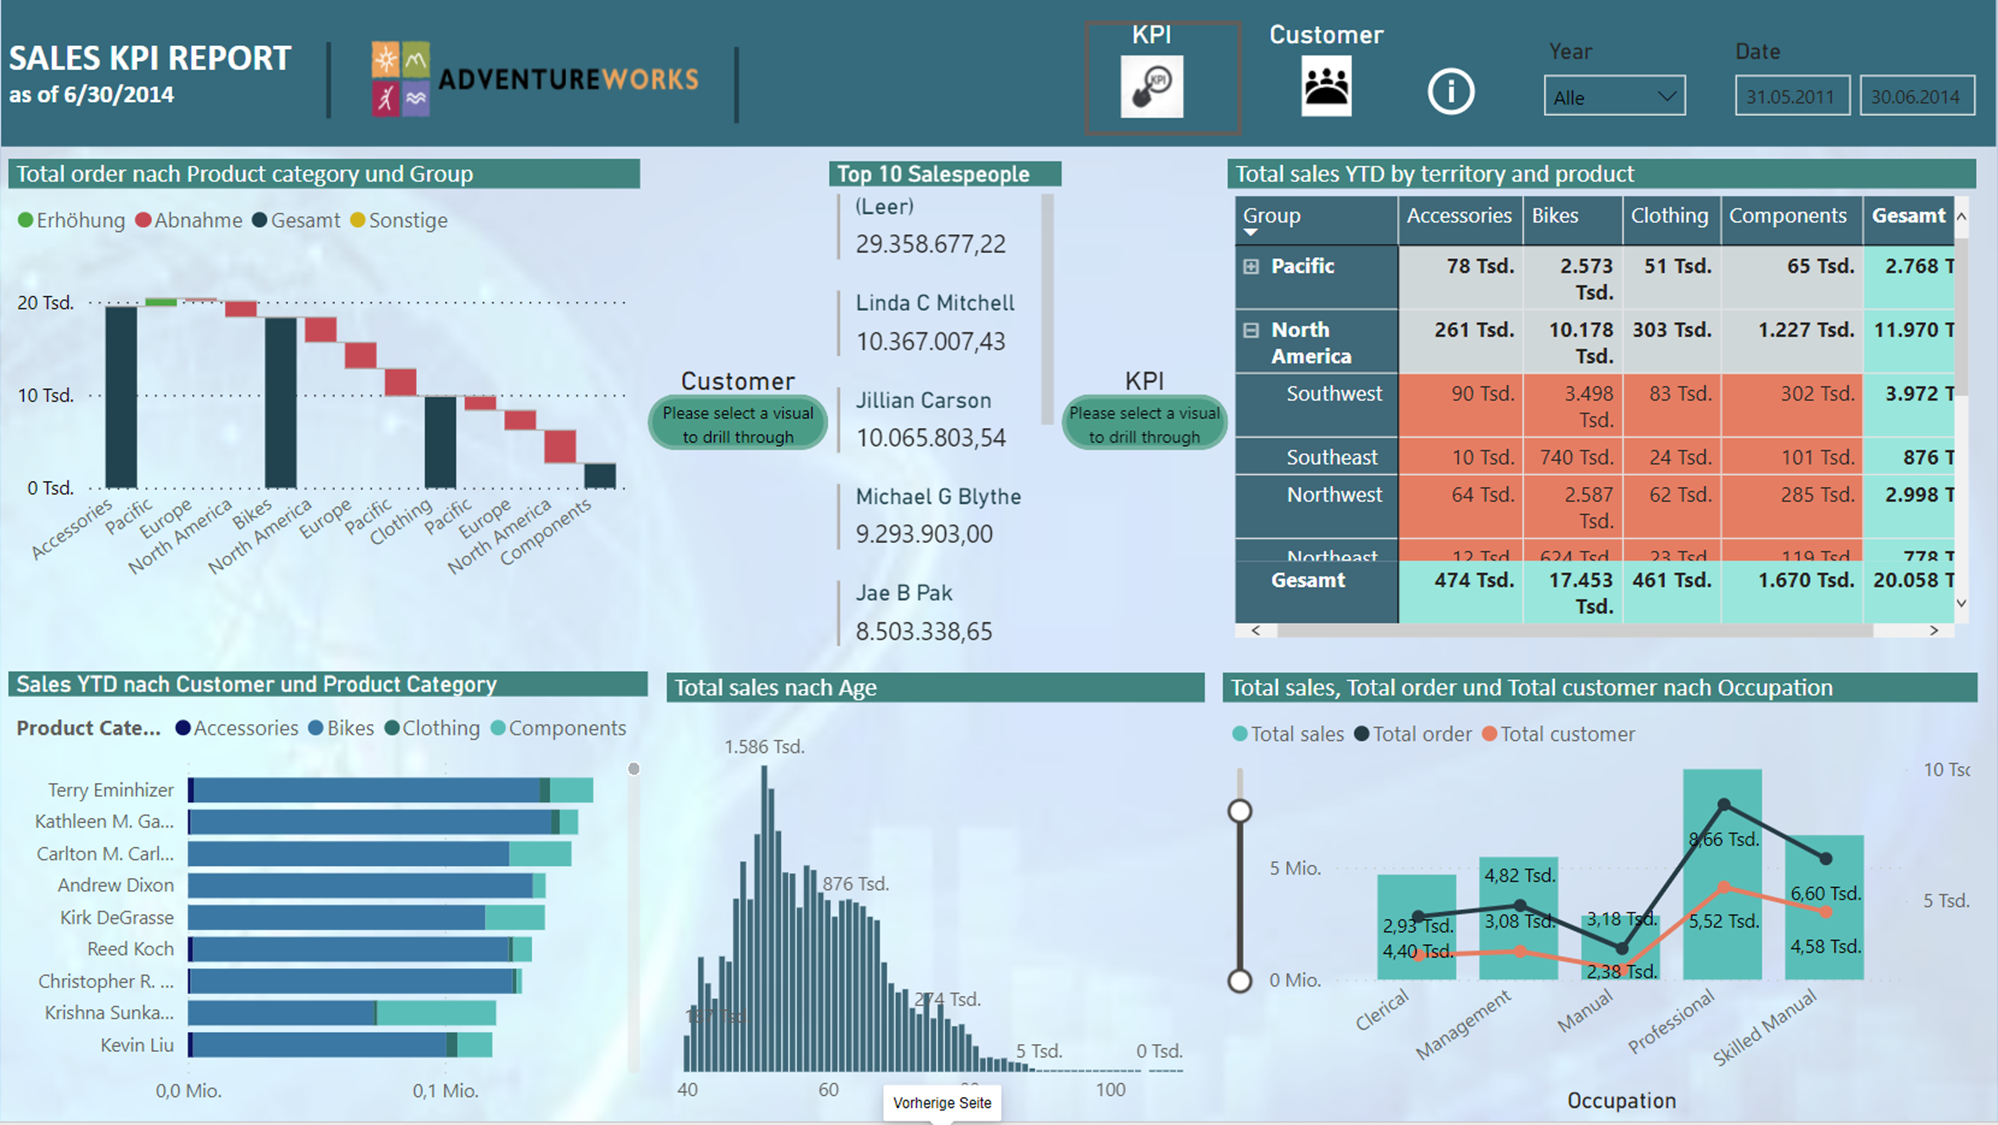
Before Andy's class, I had not paid too much attention to the role of color in presenting my facts. All I did was trying to add a lot of different colors to every inch of my visual so that it does not look plain. Sometimes, adjusting the font and color background of the title, legend, value… gets me frustrated because of the enormous amount of time and meticulous work. Now looking back at my previous works, I have realized a lot of rooms for improvement when it comes to color. Too colorfully crowded, I would say about it. Using too many colors could lead to pattern overlook. In fact, I can not identify the pattern or highlights quickly because it equally colored across the boards. What's more, my “Total sales YTD by territory and product” table shows individual sales numbers of a particular region being in red regardless of whether they surpass a target or not. On top of that, the cells total sales and subtotal sales colored in light green do not seem intuitive either; instead, I should have set up a filter rule with shaded palette to highlight the KPIs fluctuations.

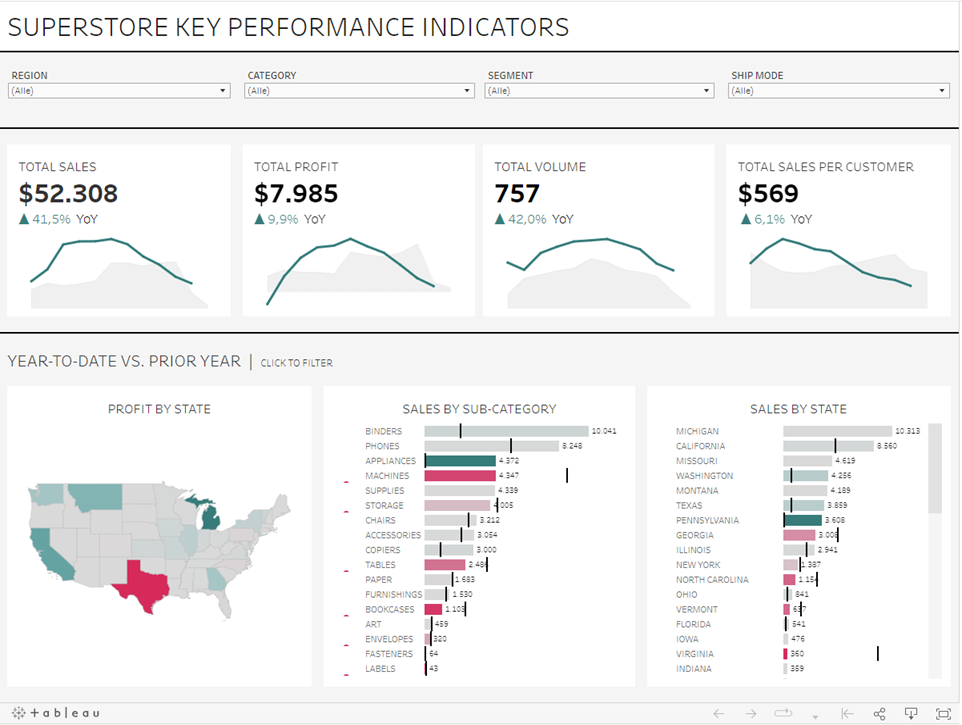
Let take Andy's Superstore Key Performance Indicators as a good example of communicating messages via color. Its background is barely filled with a strong tone but rather a simple gray shade, which I think, is a good choice. Unimportant things should stay behind the scene. People often think of green as conveying a positive message and of red as a warning. Obviously I get drawn to the green and red data at first sight, which responses to the author's intention. Simple but covering enough insights, that's how color works as an indicator.

Above all, I learn an important concept: “less is more”. From now on, I shall tell a story in a way that best addresses the audience's questions.
