When I was doing the sales pipeline funnel report, it’s desirable to create a funnel chart to encapsulate the sales pipeline process. This kind of chart also applies to streamlined process such as HR interview process where the number of observations get decreased as it proceeded further in the process.
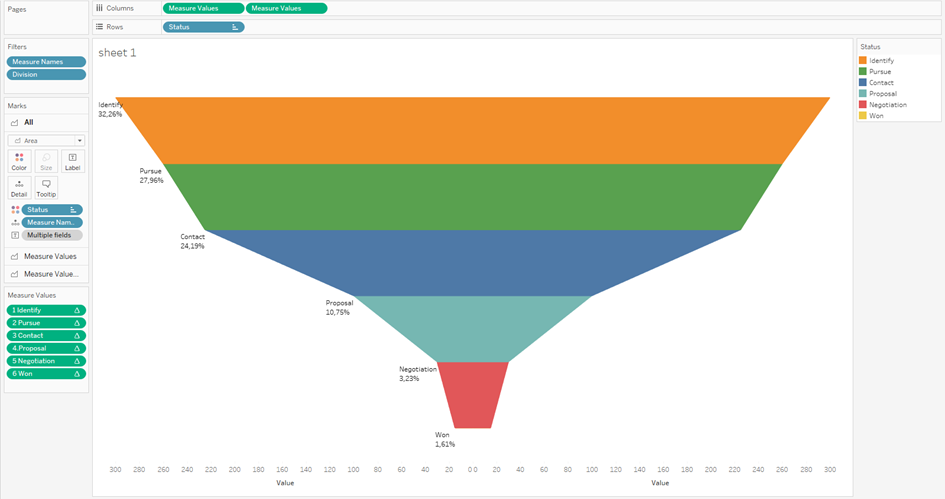
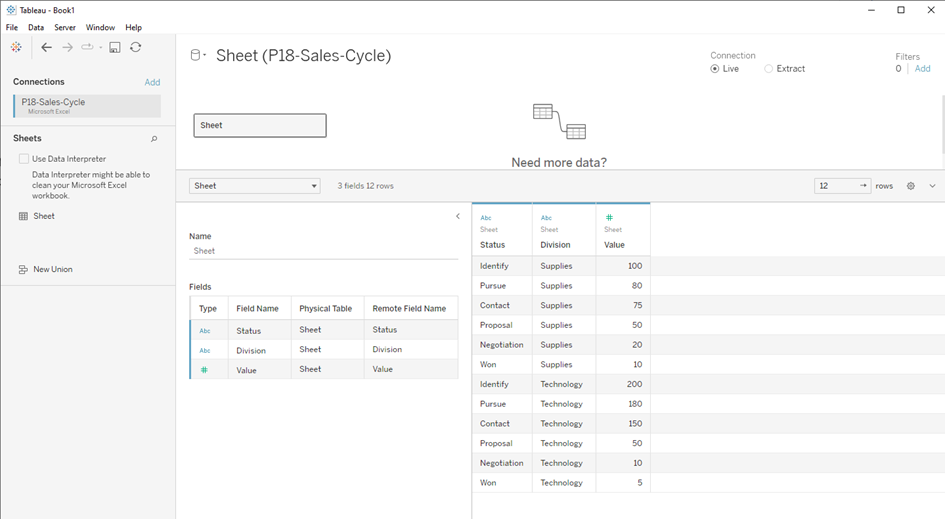
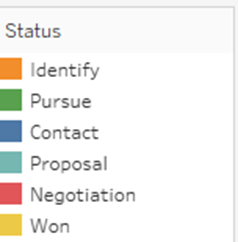
Let’s assume there is a sales pipeline consisting of 5 levels as seen in the image below:
1.Identify
2.Pursue
3.Contact
4.Proposal
5.Negotiation
6.Won
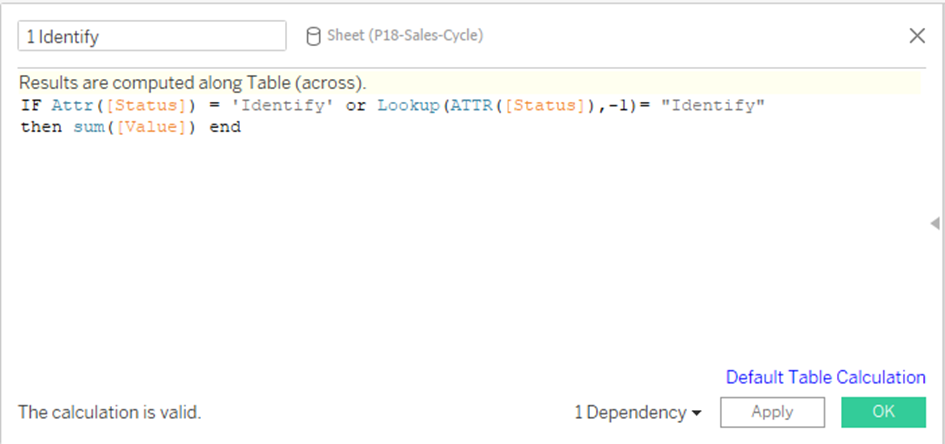
Step 1: Create Calculated Field for the status “Identify” in the sales pipeline as following:
IF Attr([Status]) = 'Identify' or Lookup(ATTR([Status]),-1)= "Identify" then sum([Value]) end
The purpose would be to sum up all values that has been defined as “identify” in the status. The Lookup function just makes sure that if the previous value of the current value in the dataset equals to “Identify” then its value would be added up as well.
Repeat the same formular for the other 5 statuses.
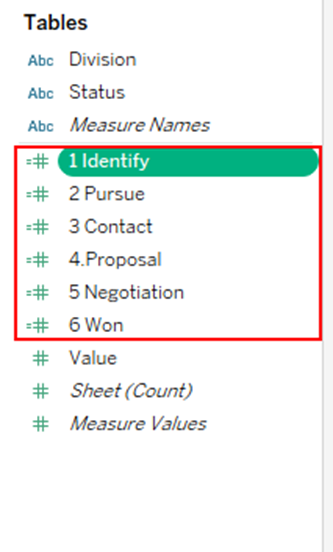
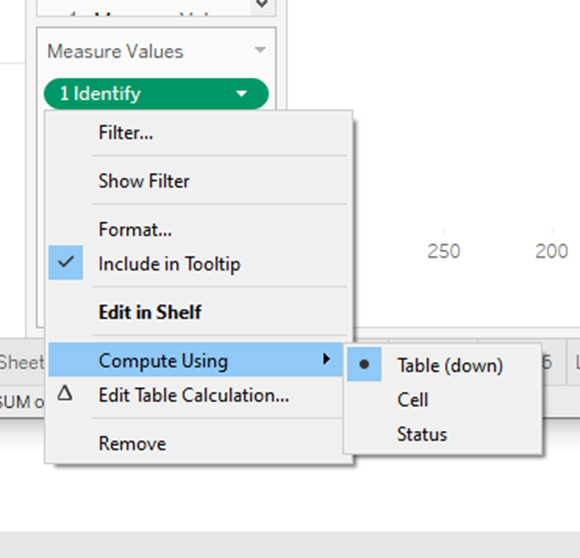
Step 2: Now that we’ve created all the necessary measures, let’s drag the Measures Values onto the Columns shelf and just retain the 6 measures freshly created. Next, just put the status onto Rows shelf. One more thing is to make sure the measures are computed along the Table Down.
Step 3: Change the chart type to Area chart. After that drag status to the Color marks and sort the status manually by changing the order in the color legend so that it appears to be the right one in the pipeline.
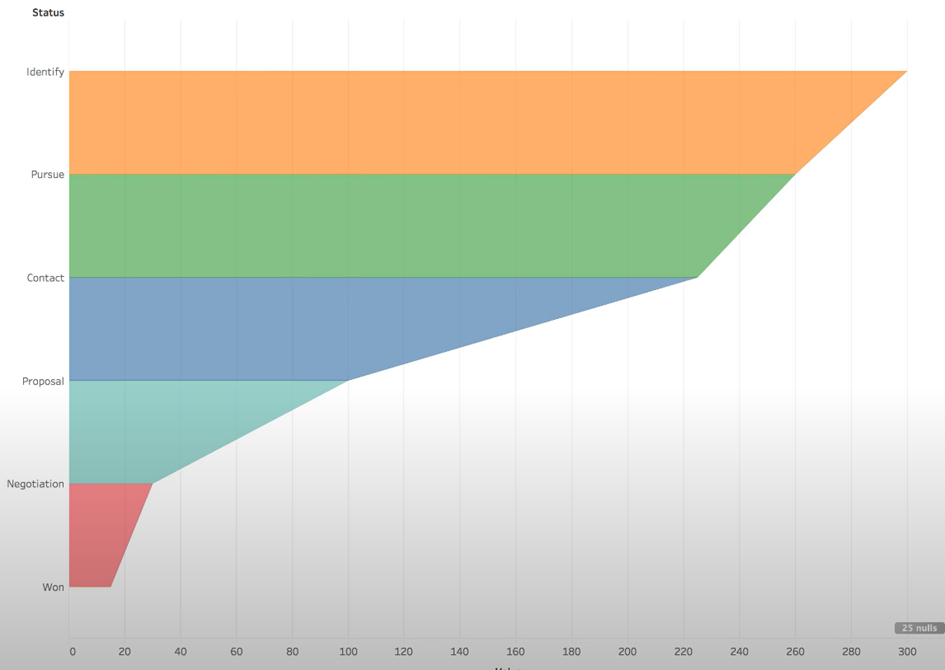
Step 4: Now the funnel begins to take shape but we want the whole funnel, not just half of it. In order to do that, we need to create a dual axis chart by duplicating the measure values in the columns.
Just click on the axis of the first Measure Values and select reversed (Scale).
Next, just put the finishing touches to the funnel chart such as labeling…Add sum(values) into label and configure the Quick Table Calculation as Percent of Total.
Depending on the particular purpose, you can also put Division into the filter cards and show filter.
Finally, this would be the expected end result.