


Hey everyone, hmm let’s see what have in another Friday’s afternoon to share. There are plenty of inspirations for infographics with amazing images that you can incorporate into your dashboards. I’m going to show you a tip to make your Dashboard more appealing with vivid images. Let’s get started.
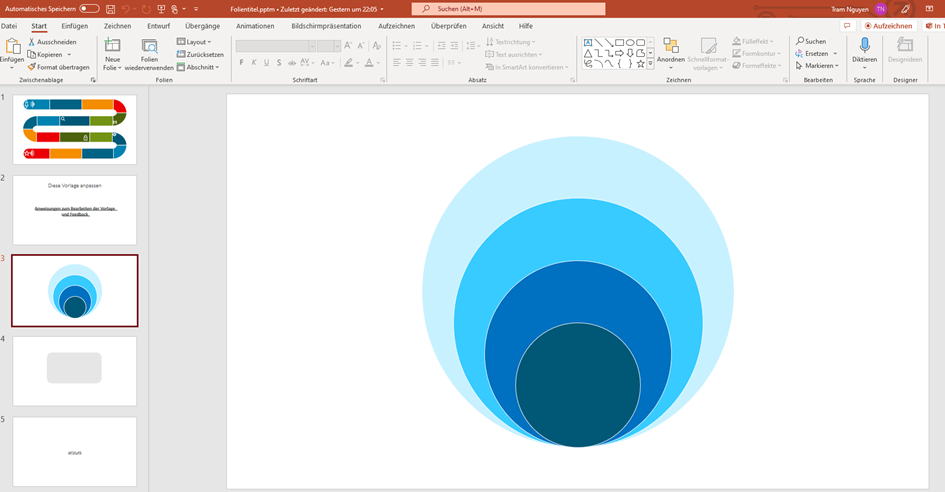
It’s very tempting to have nice templates in power point in your dashboard, isn’t it? Then just create one in power point then save it as an image file.
Open your Tableau to get the rest done.
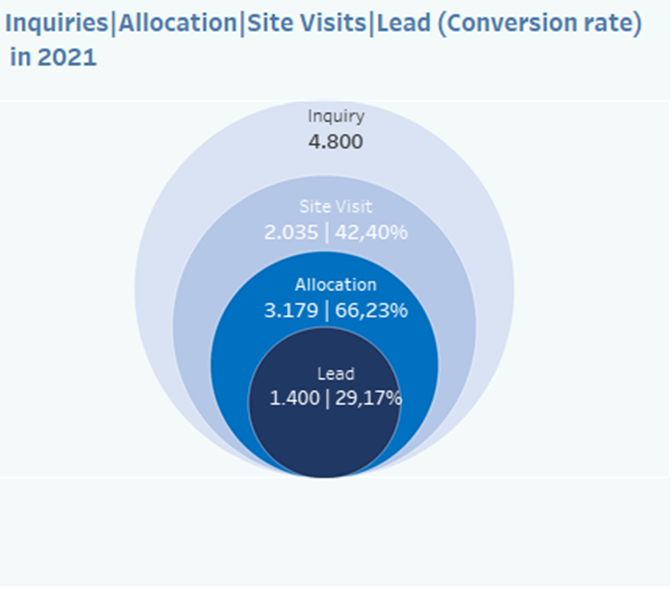
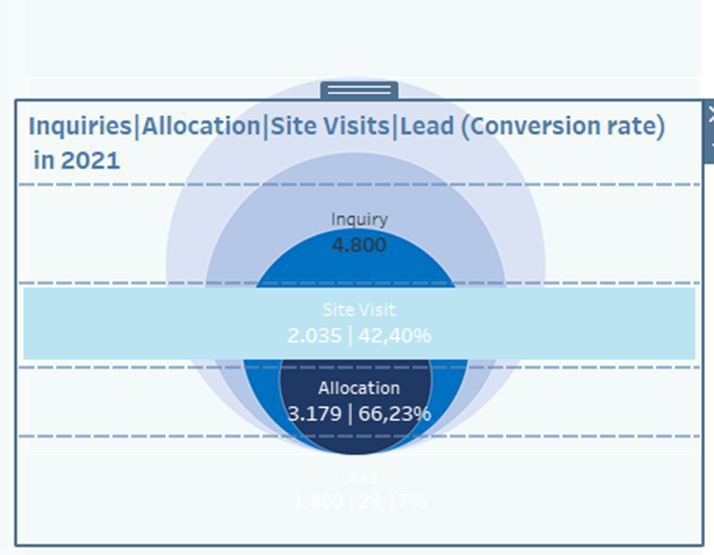
This is the ideal dashboard I created at the end. The idea is to place several KPIs above the each layer of the overlapping cycles. Each represents the number of Inquiries, allocation, site visits, and lead (conversion rate) of real estate in different regions in UK. This is a process with the most outer phase having the highest number of interests, followed by the others.
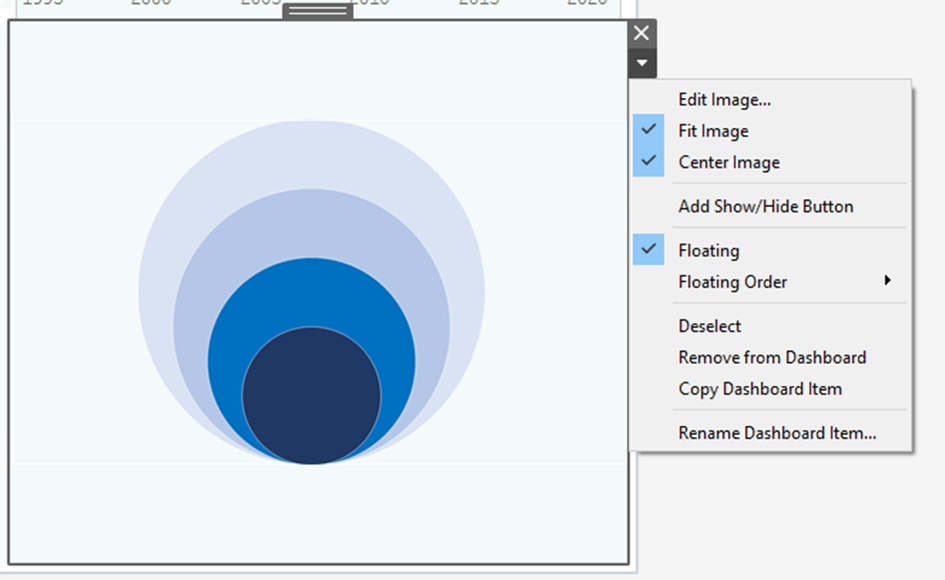
In order to create this chart, there should be a combination of floating object (to place the image below the KPIs) and containers. You would want to fix the order of KPIs.
First, you just have to create a floating object (image). After that, just leave the object at the position you want it to be.
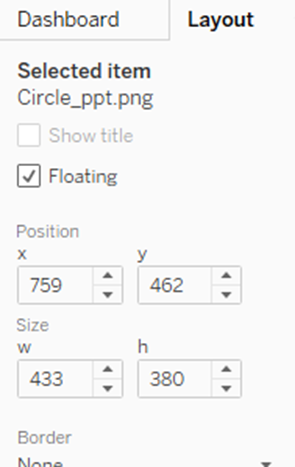
Step 2: Add a vertical container to the view and make it floating too with the same position as the floating image (layout). After that drop the 4 KPIs in the predetermined order into this container.
Step 3: Just fine-tune these KPIs so that it fits into the image as you wish.
You can visit the whole dashboard here!
I hope that this small tip makes your Tableau experience more interesting.