Today was our final day and we were given boy band data to work with. The only goal was to create a dashboard so this dashboard will be short and sweet!
There were two datasets that we had to join together. The first data was called bands and gave us information on boy bands, their song that made it to the Billboard Top 100, and the year and position they made it onto the list.
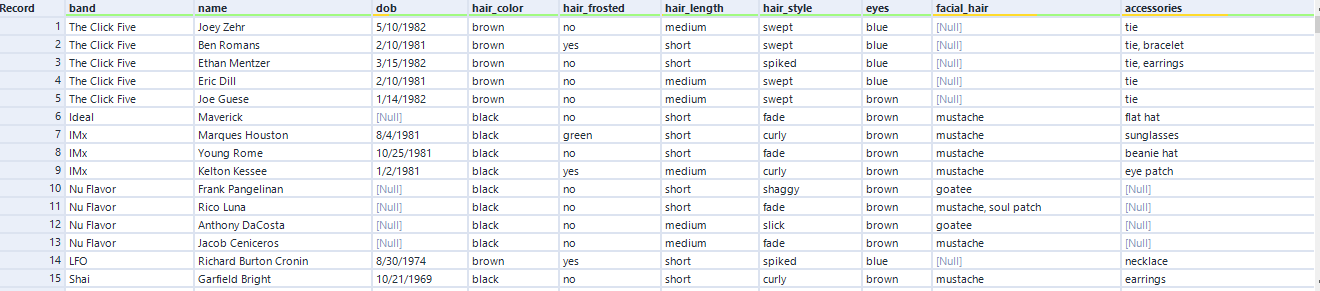
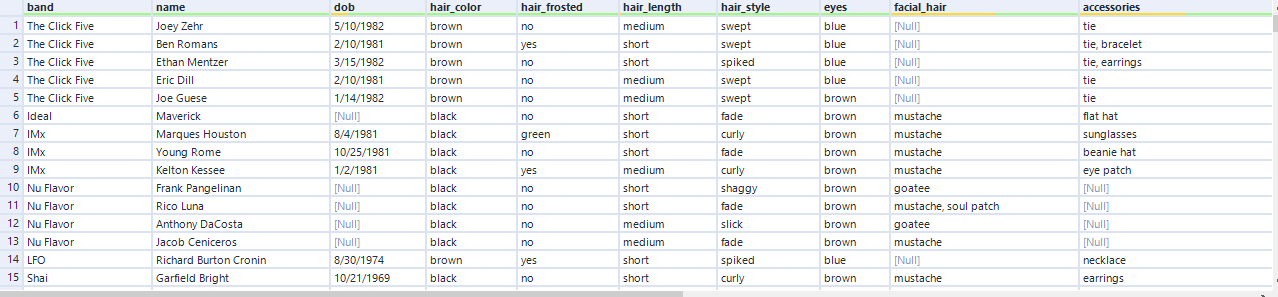
The second data source gave us a lot of information about the artists within the band, such as their year of birth, how they looked and other random information about them.
After joining the data sources together it was time to dashboard! Here are some of the questions I wanted to ask, although I didn't get to visualize all of them:
- Does having a featured artist result in higher rankings?
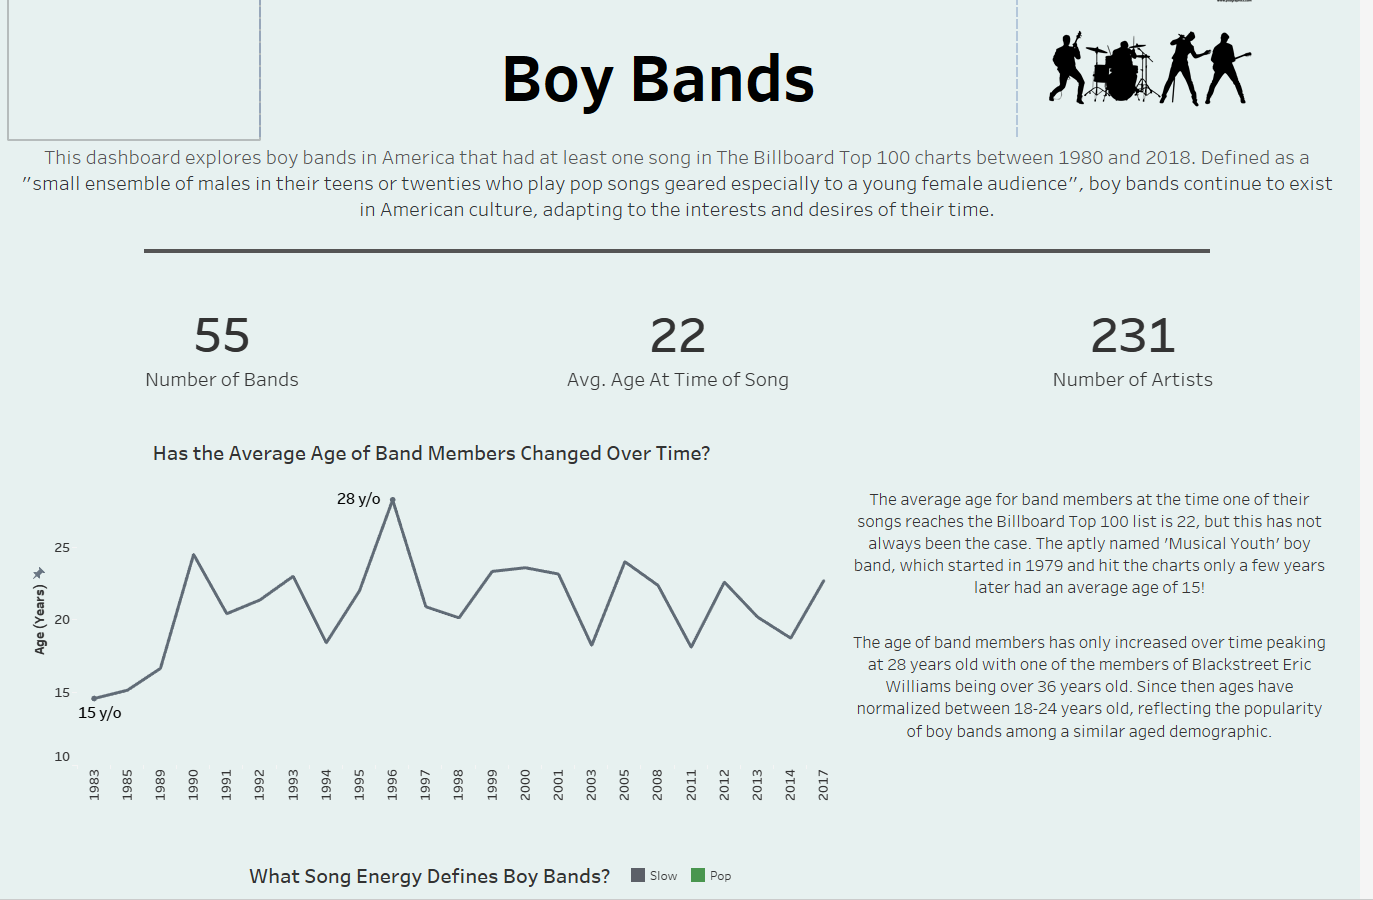
- What was the average age of the artists when they made the charts?
- Have boy bands gotten shorter?
- What was the most popular outfit in music videos?
- What has been the song's energy over time?
Here was a part of my final dashboard:
To see the rest check out my Tableau Public where it has been posted! This was an enjoyable data set to work with because I was able to do some additional research to back up the data I saw.
Dashboard week is over and I am at peace. Thank you to everyone that has supported me in my journey. I have had an invaluable experience and my life has been changed because of this opportunity.