


It has been years since its conception and Tableau has made huge progress as a data visualization tool, advancing industry standards with new innovations found in each update. That being said, no program is perfect, and Tableau is no exception. A great example of this is the fact that Desktop still does not have an option to remove the drill-down action.
Drill down is defined as "accessing successively deeper levels of a hierarchically organized database, set of files, etc.". In Tableau, we use to drill down to disaggregate the data to a lower level, allowing for new insights and perspectives. Take a look at the chart below showing the sum of profit over time. Watch as I drill down from the highest time level (year) to a much lower one (day) by clicking the little plus (+) next to the date. (Zoom into the webpage if you're having trouble seeing the gifs!)
Depending on who you are and what you need to see, the drill-down action can either be a blessing or a curse. At times, the stakeholder or viewer of the dashboard only needs to see the data aggregated at a certain level to allow for the most valuable insights. The dashboard may start at the year level, but if the drill-down action exists as a tool to modify, the viewer may be tempted to mess around with it, completely ruining the visual you wanted them to see. Unfortunately, you can't just turn off the action for dashboard viewers, and to make matters worse, the drill-down action pops up a lot, especially for dates! Fortunately, the Tableau community is crafty and has developed some solutions to bypass this oversight.
For Geographical Dimensions, Remove the Hierarchy
At times certain dimensions that share similarities may end up within a hierarchy, an ordering of variables that gets more disaggregated as it moves down. Take a look at this location hierarchy of three fields that are related geographically.
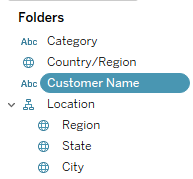
This location hierarchy can now be drilled down, starting from the Region and capable of drilling all the way down to the city. To remove this option from the viewers of the dashboard, simply remove the field from the hierarchy. They will now be unable to drill down from the specified field.
If you need to leave the hierarchy untouched for other visualizations, simply duplicate the field you are going to use and make sure it is not within the hierarchy!
For Dates, Use a Custom Value
Dates can be a little trickier and they are why I am writing this blog post. Whether continuous or discrete (green or blue pills), dates can still be disaggregated down to their smallest part. The easiest way to deal with this problem is the third option listed below, but I will give you a painful option if you don't want to go the lazy route. Imagine you want to show quantity over time by month and year. (Jan. 2020 to Dec. 2020 followed by Jan. 2021 to Dec. 2021 etc...). To get this format you have to make the field continuous because discrete dates will only give you date parts. Unfortunately, once you format it correctly you will likely still have a drill-down option.
Go to the data pane and right-click on the date field you are using in the chart. For this case, we are using the 'Order Date' field. Click on 'Create' and then 'Custom Date'. For the detail in this case we will be choosing 'Months' and leaving it as a date value to reflect the chart.
From here all you have to do is drag your new custom date field right on top of your old. It will keep your date values but fix them to just months!
Cover The Drill-Down Within A Dashboard
The only way for people to drill-down on a chart is by clicking the little plus button on the axes. So if you don't actually need to get rid of the drill-down, just make life easy and cover it up! Simply place your chart within a dashboard and grab a floating blank. Make it super small and place it right over the plus button. No one will ever know the wiser, and you will have saved yourself a bunch of time. Have a great week and keep vizzin!