


In data analytics, professionals spend a significant portion of their time - often estimated at up to 80% - on data preparation. This involves cleaning, blending, and reshaping data before it's even ready for analysis or visualisation. This manual process is not only time-consuming but also prone to error.
This is the problem Alteryx Designer is built to solve. This post will introduce the core concepts of Alteryx, and then demonstrate these concepts in action by building a workflow for a recent Alteryx Weekly Challenge.
What is Alteryx?
At its core, Alteryx Designer is a data preparation and analytics platform. It allows users to build repeatable workflows to process data without writing code.
Think of it as the ultimate data "Swiss Army knife." You can connect to virtually any data source (Excel files, text files, SQL databases, cloud applications), perform complex transformations, and then output the clean data directly into a report, a database, or a visualisation tool like Tableau or Power BI.
Its value lies primarily in its visual, drag-and-drop interface and ability to automate complex data preparation workflows.
How Does Alteryx Work? The Core Components
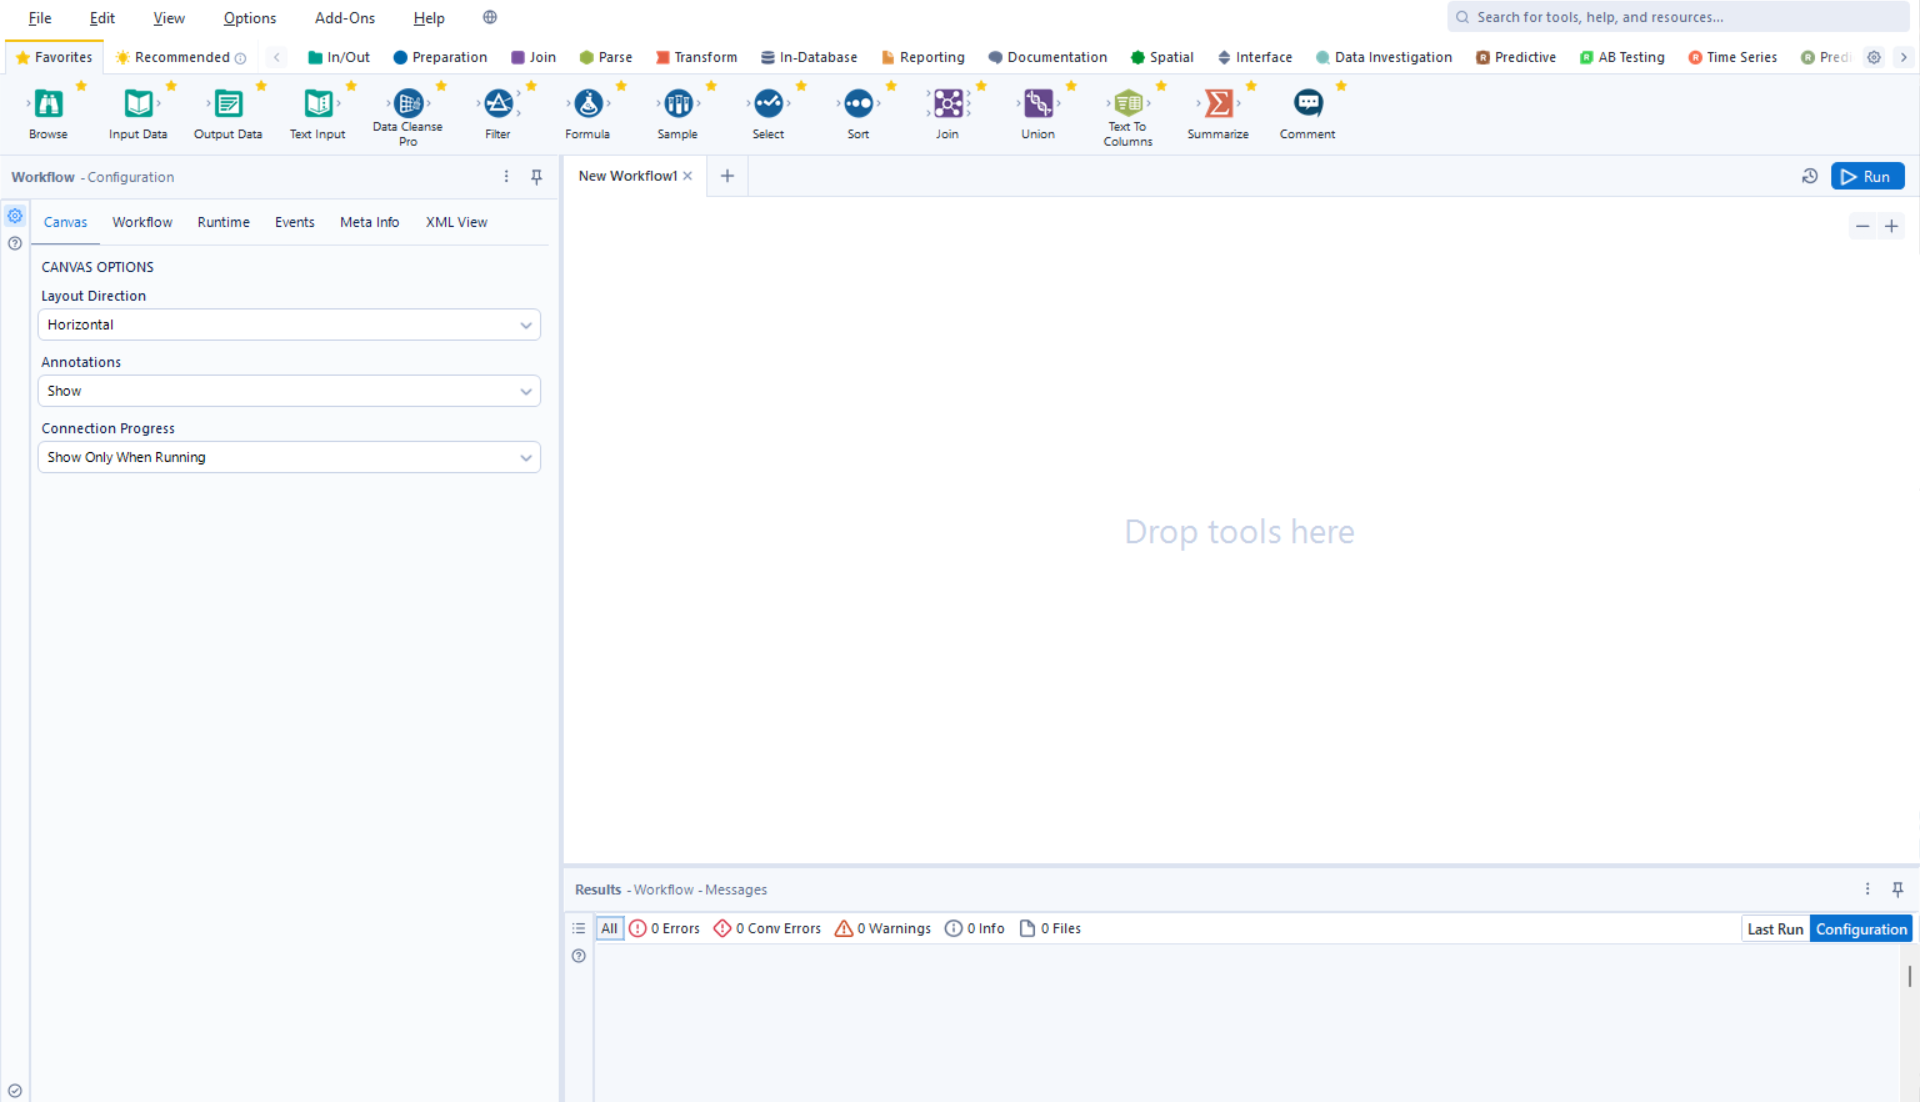
Alteryx's interface is built around three simple concepts that, when combined, become incredibly powerful.
- The Canvas: This is the blank, white space where you build your process. It provides a visual map of your entire data workflow from start to finish.
- The Tool Palette: This is your set of "building blocks." Alteryx has over 250 tools, organised into categories like "In/Out" (to read and write data), "Preparation" (to filter, select, and clean), "Join" (to combine data), and many more advanced categories like "Spatial" or "Predictive."
- The Workflow (not pictured): This is the end-to-end process you build within the canvas. You build a workflow by dragging tools onto the canvas and connecting them. Data "flows" from left to right, being transformed at each step.
The true power of this system is repeatability. Once you build a workflow, you can save it and run it again every time your data updates - whether that's daily, weekly, or monthly. A process that once took hours of manual work in Excel can be executed in seconds.
Why Use Alteryx?
For aspiring data professionals, Alteryx provides several key advantages:
- Speed: It drastically accelerates the most time-consuming parts of data prep.
- Accessibility: It empowers analysts to perform complex tasks (like blending, spatial analysis, or predictive modeling) that would otherwise require advanced programming skills in languages like Python or SQL.
- Transparency & Governance: A visual workflow is self-documenting. Anyone (including your future self) can open your workflow and understand the exact logic and transformations being applied to the data, which is crucial for accuracy and governance.
Putting Theory into Practice
The best way to learn any software is to learn by doing. With that being said, let's jump into Alteryx and walk through an Alteryx challenge we recently completed when we were introduced to Alteryx at The Data School.
Alteryx Weekly Challenge 337
In this challenge, the task is to take a Netflix dataset and create a new, refined list of "International Movies." This requires us to:
- Filter the list to only "International Movies."
- Select only the specific columns we care about (Categories, Type, Title, etc.).
- Sort this final list by Release Year and then by Duration.
This task, which might be cumbersome in Excel, is a perfect demonstration of an Alteryx workflow.
The challenge provides an input data file, and provides an example of the output data. Your task is to match your output to the example given.
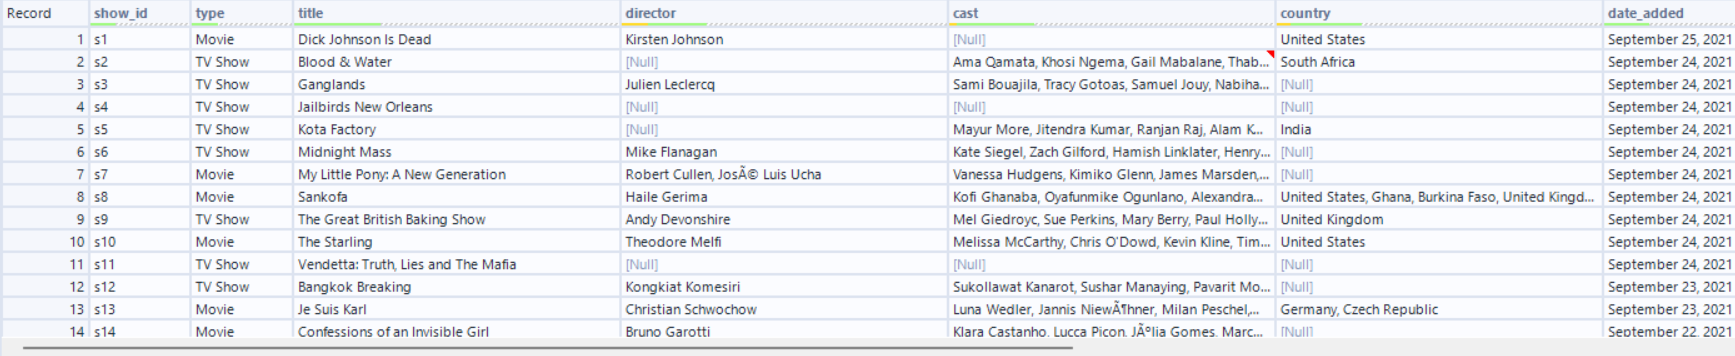
Input Data
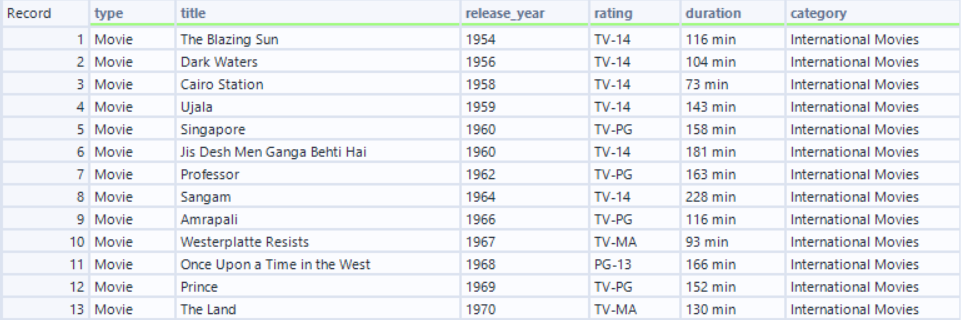
Output Data (Goal)
To follow along with the challenge, go to this link and download the start file: https://community.alteryx.com/t5/Weekly-Challenges/Challenge-337-Create-a-New-List-from-an-Existing-List/td-p/1002947
Step 1
The challenge asks us to create a list of movies arranged in order by the year of release and duration, and details the specific fields we need to include in our list.
However, it also says our list should contain only "international movies".
Looking at the input data, we can see that movie categories are contained within the "listed_in" field:
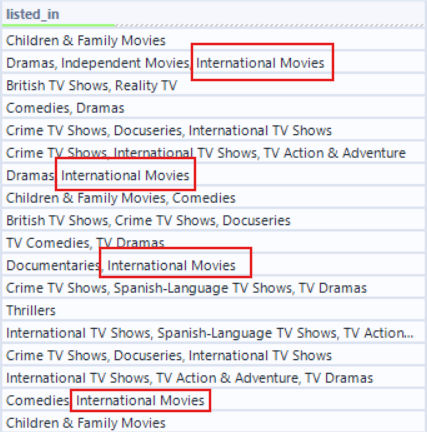
So our first step is to filter only those movies that are categorised as being an international movie.
To do this, we can use the Filter Tool.

Connect the filter tool to your input data.
Since each cell contains multiple categories as one single string, we need to see if that string contains "International movies" and filter for those. Here's how we can set up our filter tool to achieve that:
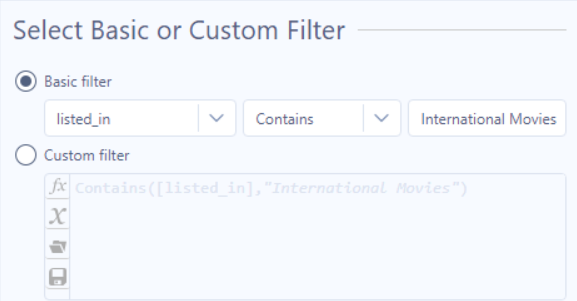
Run your workflow. The T output of your filter tool should now include only those records that are categorised as an international movie.
Step 2
Next, the challenge asks for our list to be ordered by the year of release and the film duration. For this, we can use the Sort Tool.

Connect a Sort Tool after your Filter.
Your Sort Tool configuration pane will look like this:

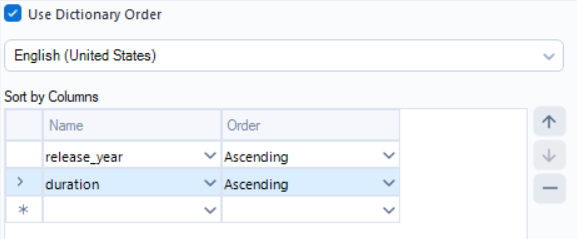
We want to sort by the year of release, so select "release_year" and for order, select "ascending" so that the earliest films show first.
Then, select "duration", also ascending. Now when we have two or more films with the same release year, they will be sorted by their duration.
Your sort tool configuration should now look like this:
And the output of your sort like this:

Step 3
In order to match the output for this challenge, we need a field named "Category" which contains only "International Movies" for each record.
Currently, we only have a field called "listed_in" which still contains all of the categories for that record. However, we can use this to create our new "Category" field using the Formula Tool.

The Formula tool allows you to either change a field, or create a new field by writing an expression.
For this step, we need to create a new field called "Category". We can populate by using an IF statement, checking whether the "listed_in" field contains "International Movies" and, if it does, adding this string to our new Category field.
Here's how this logic looks written in the formula tool:
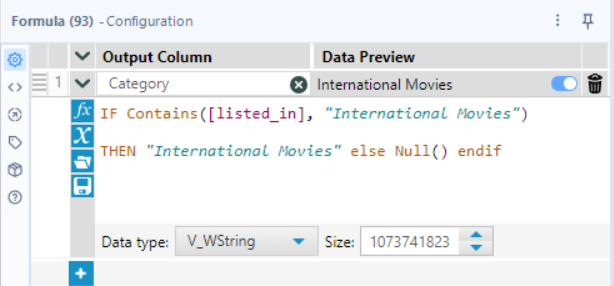
The output should now show our new field with "International Movies" in each cell.
Step 4
Our last step in order to match the output data is to remove any unnecessary columns. For this, we can use the Select Tool.

The Select tool allows us to choose which fields we'd like to include/exclude, what data type each field is, and we can also rename and descriptions to each field.
We do not need to keep all of our fields for this challenge, so we can simply untick those fields we don't need.
Here's how your select tool should look:

Challenge Complete!
Your output should now contain a list of films with information on it's type, title, release year, rating, and duration, ordered by their release year and duration. Well done!
This challenge has been an introduction to some of Alteryx's basic functionality, covering 4 of its most used tools. However, we have only scratched the surface! Alteryx contains over 270 tools and is a very powerful software.
If you'd like to take your training in Alteryx further, there are plenty more challenges to try out here https://community.alteryx.com/t5/Weekly-Challenges/bd-p/weeklychallenge#post_time|solved-and-unsolved|0-Basic|1
-- Tyler