What are Sets
In Tableau, sets are custom fields that define a subset of your data based on specific rules or selections. They allow you to single out and compare segments of your data. For example, a set could be used to view the top 10 customers by sales, or all products with profit above a certain value. Unlike filters, sets can be reused across multiple worksheets, incorporated into calculations, and even made interactive through set actions (set actions have not been covered in this blog). This makes them a powerful tool for dynamic analysis and user-driven insights.
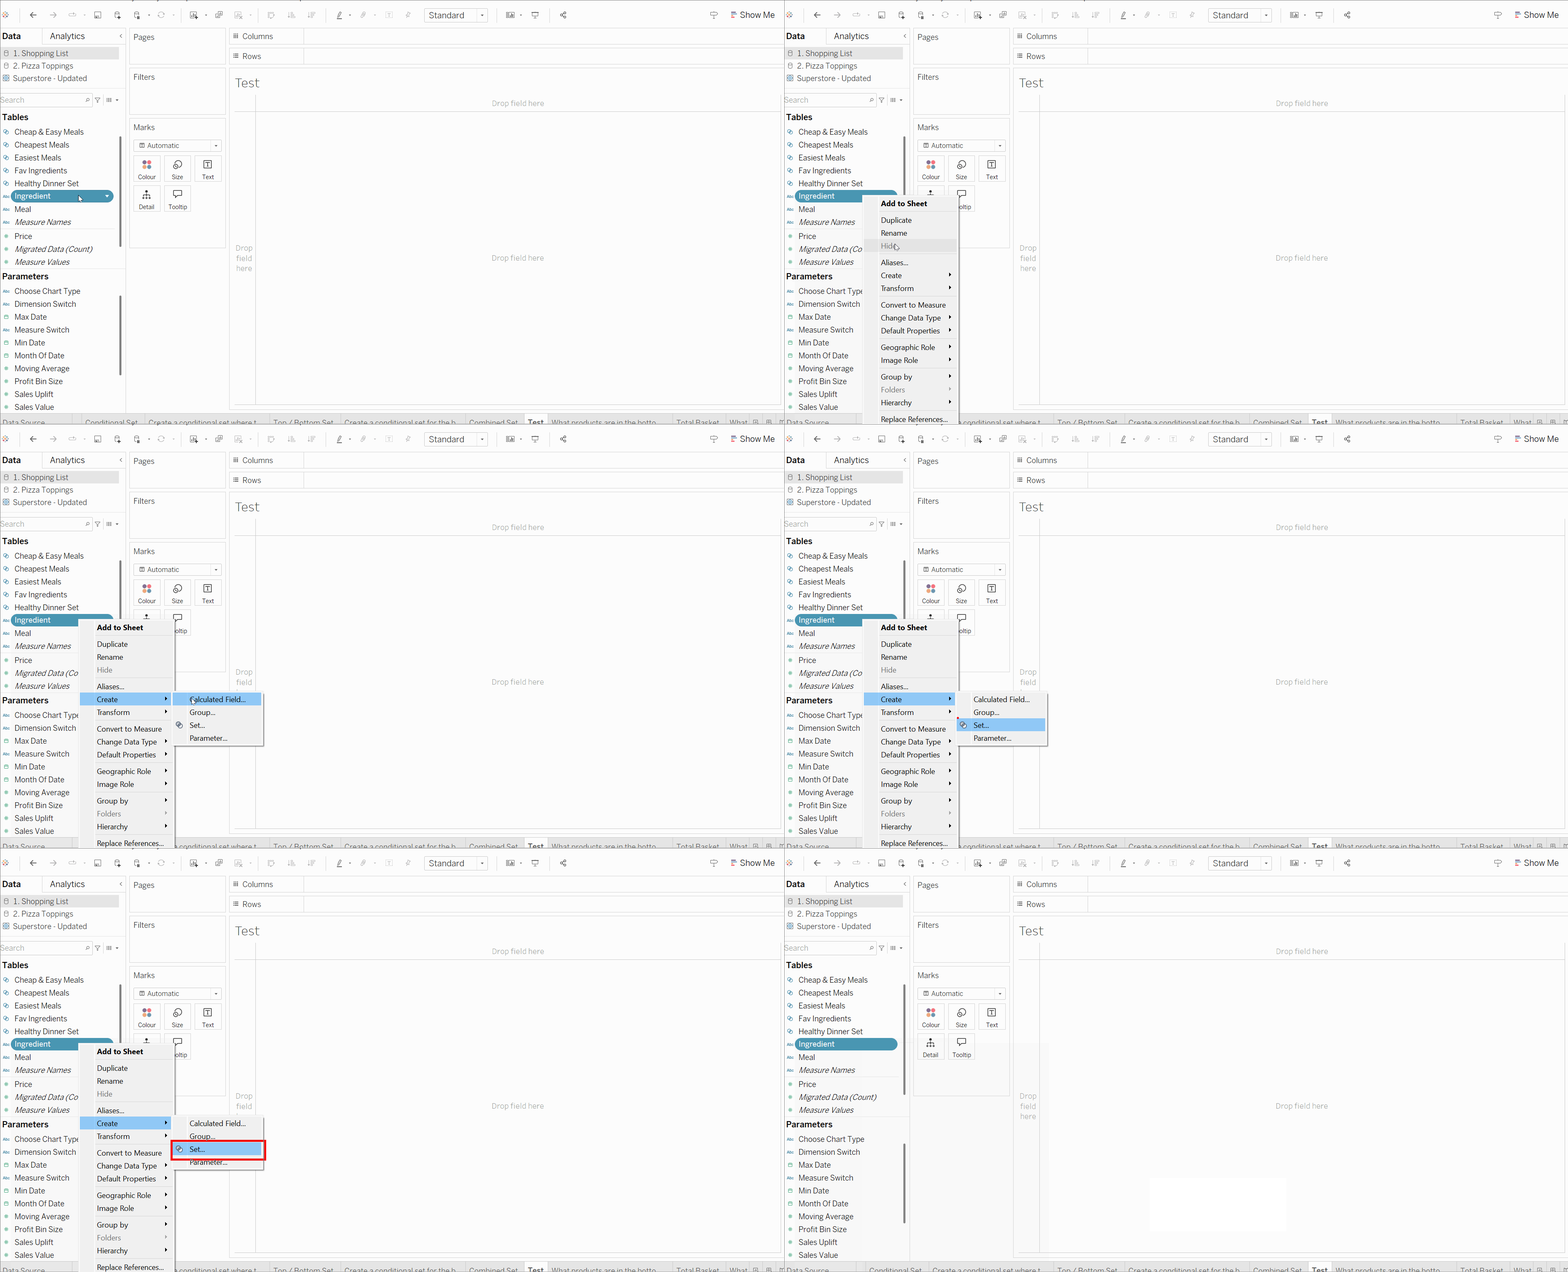
Sets can only be created using dimensions, but they can be defined by certain measures. See below to see how you would create a set in Tableau Desktop.

There are two different types of sets, which contain a different style of sets within them.
These are:
Constant Sets
These are created manually by selecting individual members from a dimension (for example, selecting specific products or regions).
Constant sets are static, this means that items part of this set do not change unless the user manually updates the set.
Computed Sets
Computed sets are based on a rule or logic. Computed sets are dynamic, and update when data changes. There are three sets that then encompass under the term Computed sets. These are:
a) Conditional Sets - members meet a condition (e.g. SUM(Sales) > 10,000)
b) Top/Bottom Sets - e.g. Top 10 customers by profit
c) Combined Sets - union, intersect, or exclude members from two existing sets.
When/Why to Use Sets
The greater flexibility and functionality of sets gives them a clear advantage over simply using filters or groups. Unlike filters, which only control what’s visible, sets allow you to define a group of values that can be reused across multiple charts, used in calculated fields, or adjusted through user interaction.
For example, you might use a set to track your top 10 products by sales, and then compare them to the rest of your product range across several dashboards. Or you might create a set of customers who meet a certain threshold (e.g. profit > £5000), and highlight them differently in a visual. This is all without filtering out the rest of the data.
Overall, sets help make your analysis more flexible, reusable, and insightful, especially when working with large datasets or exploring trends over time. Now below I can display a walkthrough example of how combined sets can be utilised in a dashboard.
