


When building a dashboard in Tableau, one of the main challenges many designers face is the lack of screen space. You’ve got tons of graphs to show but you also want to keep your dashboard clean and user-friendly. So how do you balance detail with simplicity?
This is where Dynamic Zone Visibility comes into play. It’s a simple but powerful feature that lets you make your dashboards more interactive whilst being less cluttered, all without sacrificing any of your key insights.
What is Dynamic Zone Visibility?
Dynamic Zone Visibility is a feature in Tableau that allows you to show or hide containers (or other objects) on your dashboard based on user interaction. It's especially useful when you want to give your users the option to toggle between views or display additional detail on demand. This can be done simply by creating a show/hide parameter, or through more advanced techniques such as integrating it with existing visuals in the dashboard using parameter actions.
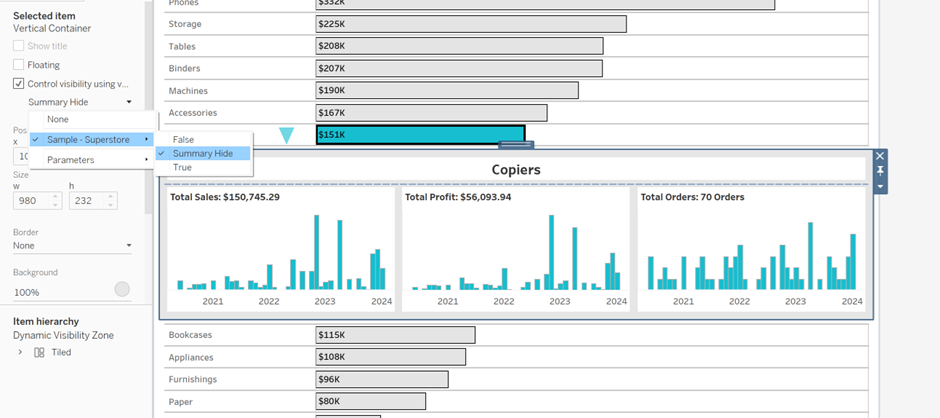
Here’s an example I created, modelled after a fantastic viz by Robbin Vernooij - one of the coaches at the Data School. The goal of this viz: build an interactive dashboard that allowed users to drill down into more detailed information regarding a sub-category without cluttering the screen from the get-go.
By using dynamic visibility, I was able to hide certain charts until a user clicked a button, making the whole dashboard cleaner and much easier to navigate.
So, how can we build this? Below are the main steps I took to integrate Dynamic Zone Visibility into my dashboard. One thing to note is that the final viz also incorporates other techniques (including a few “hacky” ones) to achieve the final look and feel. To avoid confusion, I’ll focus here just on the key steps needed to create the Dynamic Zone Visibility. If you’re curious about the full construction, feel free to check out the viz here, download the workbook, and reverse-engineer the actions used.
- Creating a parameter
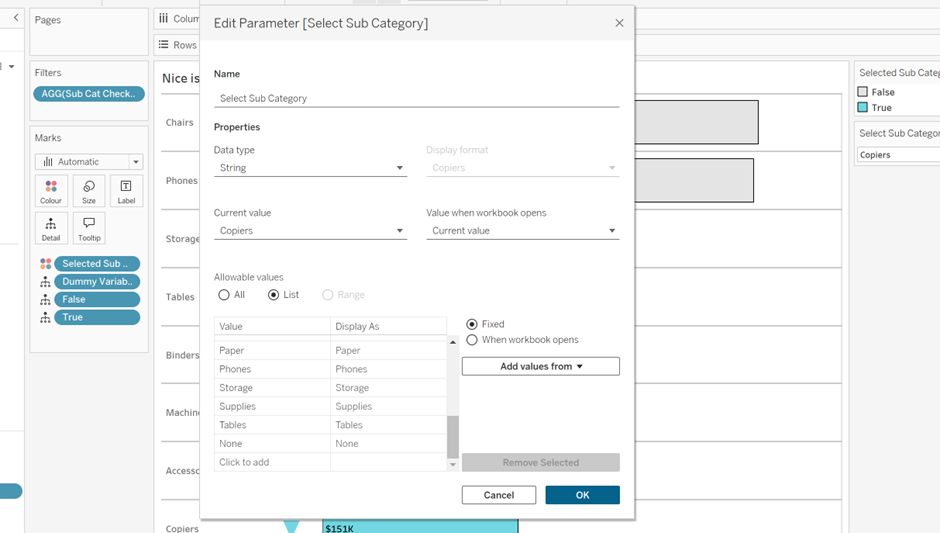
The first step is to create a parameter based on the field you want users to interact with - in this case, Sub-Category. You can populate this list using the “Add values from” option under allowable values, selecting Sub-Category to automatically fill in the unique values.
Once the list is populated, it’s important to add one more custom value: “None”. This will act as the default (or off) state, used when no Sub-Category is selected, essentially hiding the dynamic container when it's not in use.
- Incorporating the parameter into a calculation (Show/Hide)
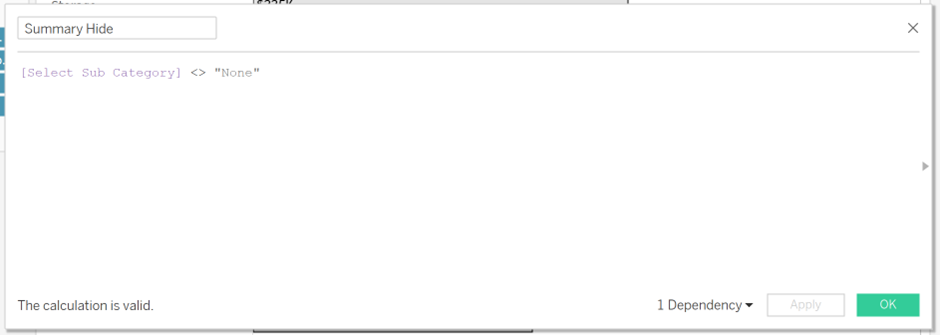
Next, we need to use the parameter in a calculated field that will control the visibility of our container. Dynamic Zone Visibility in Tableau requires a Boolean field (i.e., something that returns True or False), so the logic must reflect that.
In this case, we want the container to show when a Sub-Category is selected, and hide when the parameter value is “None.” So our calculated field will return True when something is selected, and False when “None” is chosen.
- Creating a parameter action
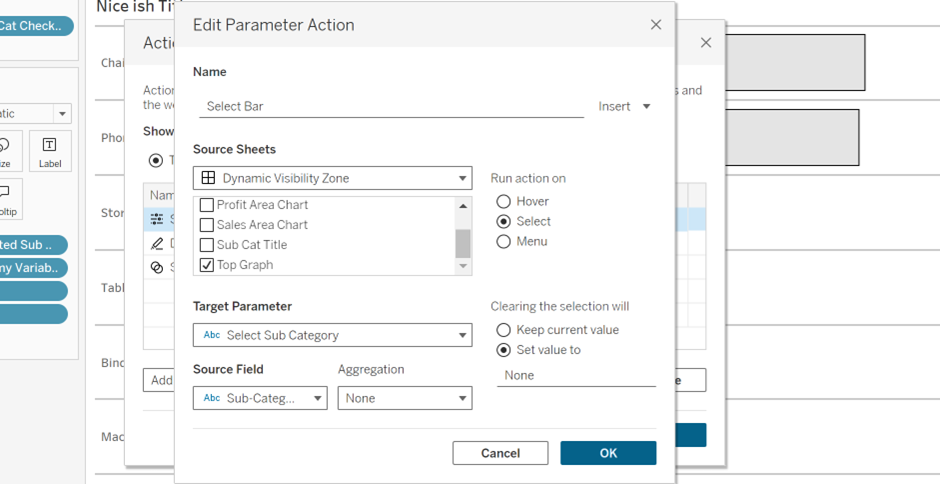
Now it’s time to set up the user interaction with the parameter. In the dashboard, go to Dashboard > Actions, then choose Add Parameter Action. Configure the action to update the parameter when a Sub-Category is selected on the graph.
One important detail here is setting up what happens when the user clears their selection. Under Clearing the selection, choose to assign the value “None” - the option we added to the parameter earlier. Since None doesn’t actually exist in the graph, this will effectively clear any active selections (and eventually hide the dynamic container).
- Add the Dynamic Zone Visibility Controls
The final step is to configure the container so that it only appears when a Sub-Category is selected. To do this, click on the container in your dashboard, then on the left-hand pane, check the box for “Control visibility using value.” From the dropdown, select the calculated field we created earlier (the one that returns True or False based on the parameter value).
With this in place, the container will now dynamically appear when a valid Sub-Category is selected and disappear when it’s cleared.
And that’s it. As mentioned this is not all the steps I took to create this visual, however this is how the Dynamic Visibility Zone was configured to Show/Hide when a Sub-Category in the bar chart was selected.
Thanks for reading! 😊
Victor