Hello there!
Welcome to my first dashboard week blog.
By 8.50am. We received the data. It’s about drones. Here’s the link to the source.The Center for the Study of the Drone.
By 10.15 The data cleaning was done; Here’s what the workflow looked like;
After creating the workflow I decided to plan the rest of my day scheduling in the following breaks
- 15 mins to run through and practice the presentation
- 45 mins for lunch – It can always be shorter
I then drew out my dashboard and listed what I needed to do and got through the tasks one at a time.
I wanted to use set actions as I haven’t used them much so decided to incorporate them for both maps I was presenting.
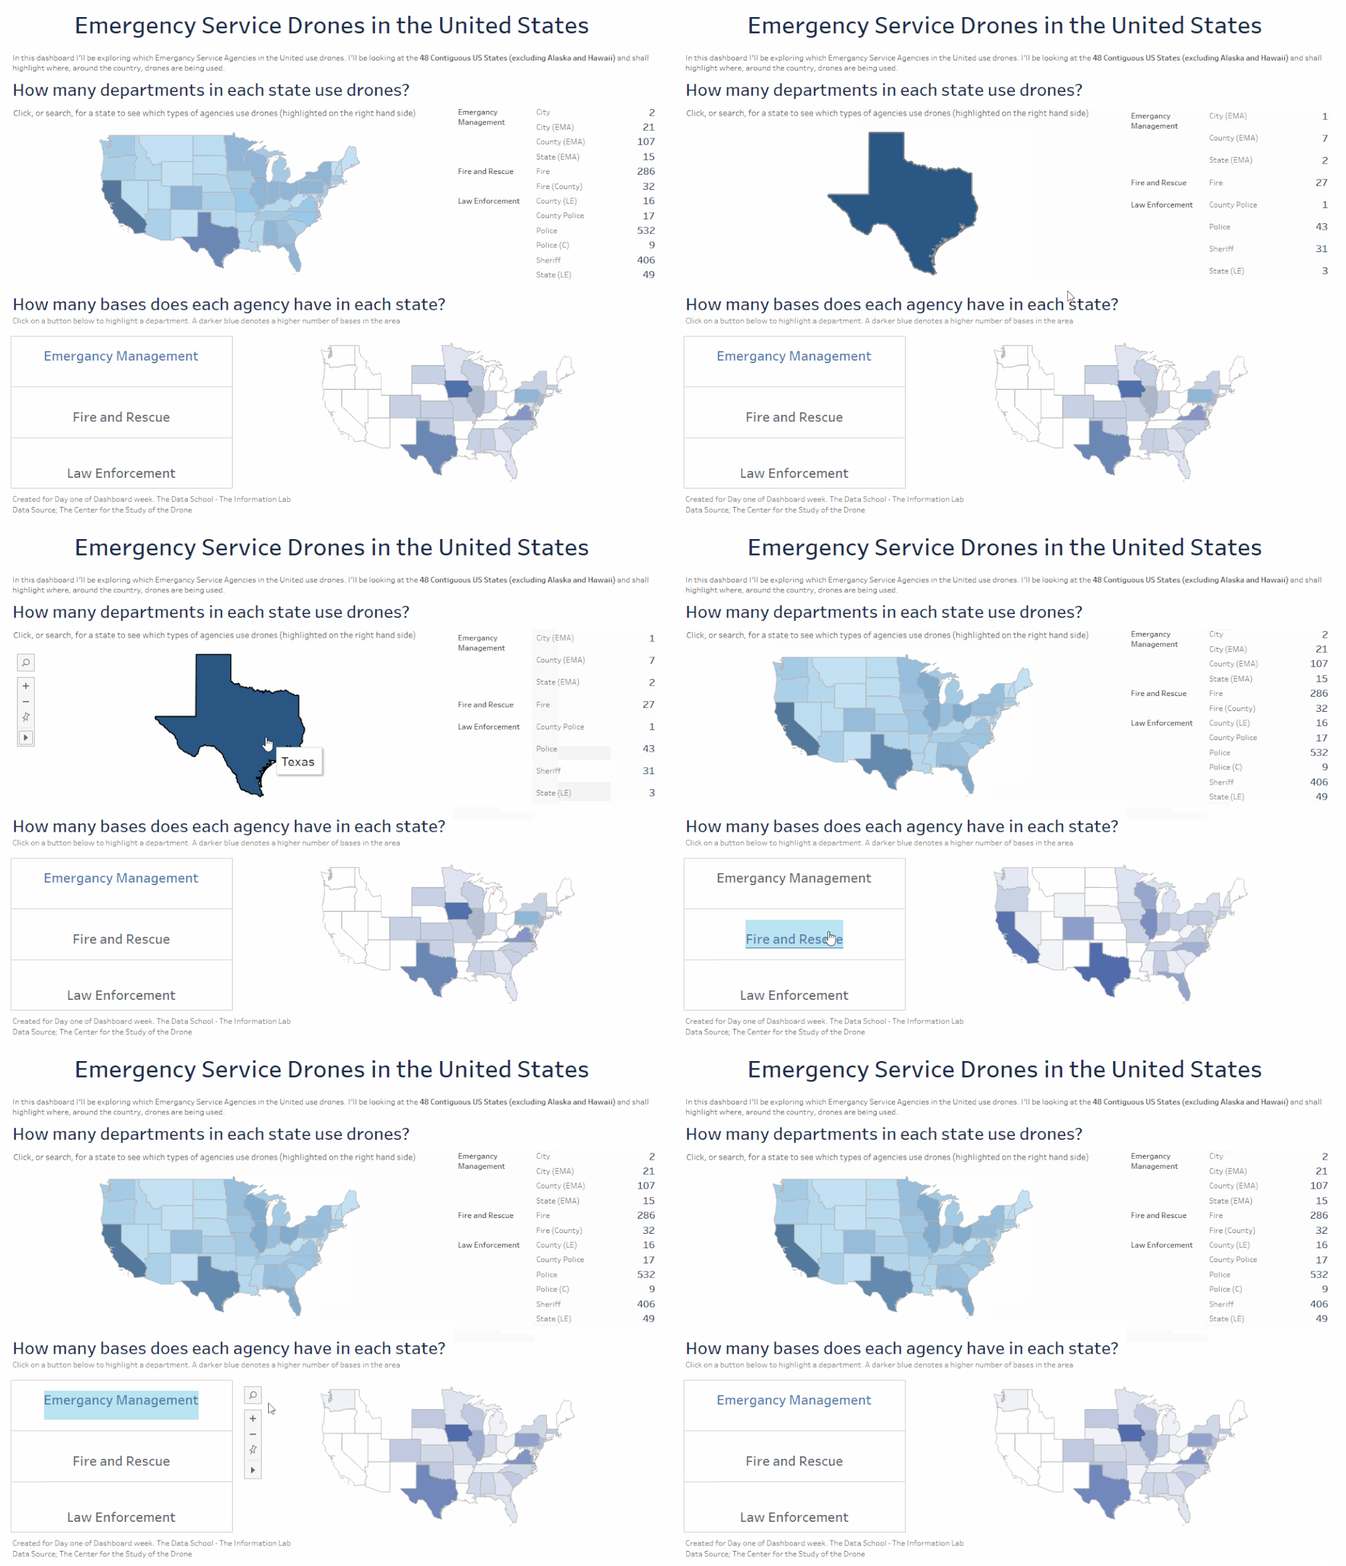
A few hours later this was the final outcome;

https://public.tableau.com/profile/vikash.bhardwaj1491#!/vizhome/DronesintheUnitedStates/Dashboard
I’m not as happy with it as I would have liked to have been as I don’t feel like it’s that interesting but I am pleased I was able to complete it in time and get everything working before the presentation.
Thanks for reading!
