In this blog I’ll be showing how to use a parameter to be able to switch between multiple sheets on a dashboard.
Use cases for this can include;
- wanting to show multiple visualizations on the same dashboard in the same space
- to show multiple types of visualization on the same dashboard (which could be useful if the end user has a preference on how they would like to see the information)
Just before we start.. this technique highlights the importance of naming sheets well. Please be sure t take care when naming and inputting names. If an error is input at some point debugging can take up a lot of time finding where the error is.
There are 4 steps to creating this functionality
Step 1) Create a Parameter
Step 2) Create a calculated field
Step 3) Add a filter to each sheet
Step 4) Building the dashboard
Lets begin
In this example I’m using the Tableau sample superstore data and plotting SUM(Profit) on my rows and YEAR(Order Date) on my columns.
The first step is to create the visualizations you would like to see have on the dashboard. The three I have created are;
Sheet 1- bar
Sheet 2- circle
Sheet 3- area chart
Step 1) Create a Parameter
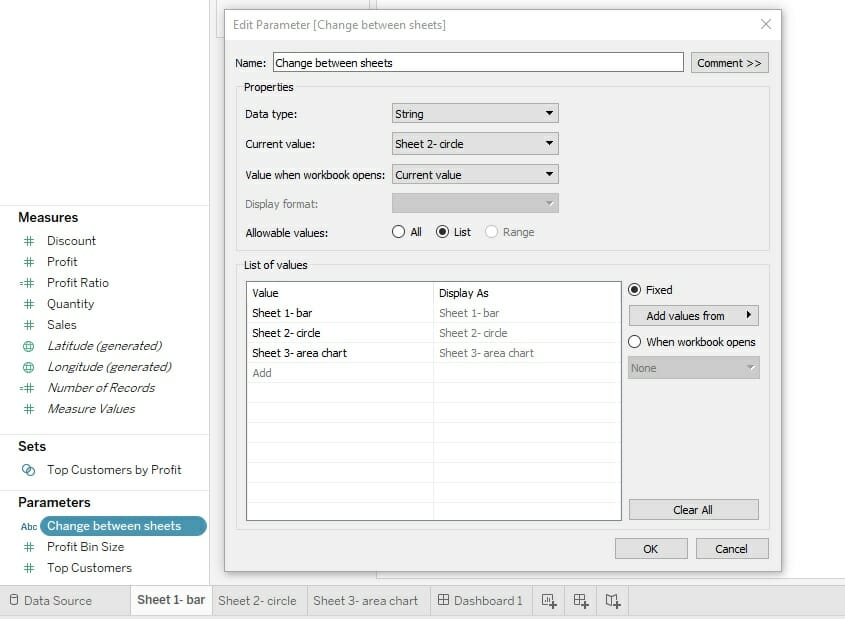
We will be using a parameter to create the drop down menu to switch between the sheets. To do this, click on drop-down arrow next to the Dimensions card and click “Create a parameter…”. Once the box has opened change the data type to “String”, select “List” from Allowable values and input the names of the sheets you want to display. Ensure they are typed out on your sheet making sure they match the sheet names that you want to switch between,

After this, right click on the Parameter and click “Show parameter control” to add it to the worksheet.
Step 2) Create a calculated field
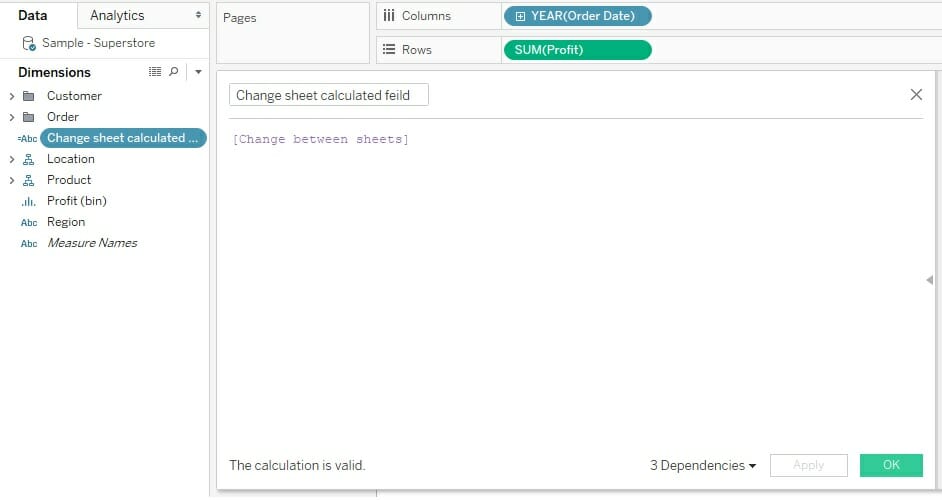
Create a Calculated field and simply add the parameter to it and click Ok. I’ve called mine “Change sheet calculated field”. You can add your parameter by dragging and dropping it into the formula box. Simply do this and this step is complete.

Step 3) Add a filter to each sheet
Now we need to create a filter connecting the sheets to the parameter.
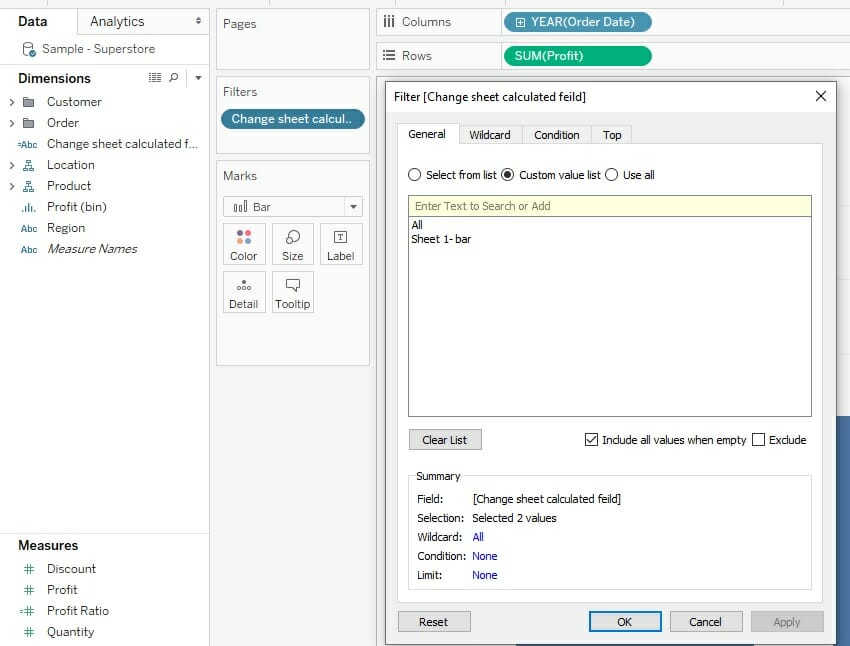
Drag the calculated field to the sheet and edit the settings as follows;
- Select Custom value list
- Add the name of sheet and and “All” – in this example I added “sheet 1- bar” and “All” into the yellow band
- Click Ok so the filter is added to the sheet
Repeat for every sheet you want adding to the parameter making sure the name of the sheet input here matches the corresponding name in the parameter.
By the end of this step, each sheet you want with this parameter should have the calculated field you created in Step 2 in the Filters card for each of the visualizations you would like to change on your dashboard.
Don’t worry if it seems some of the visualizations have disappeared, the parameter is now working and only showing the dashboard selected. If you would like to see / edit each sheet select the sheet you would like to view from your parameter.
Step 4) Building the dashboard
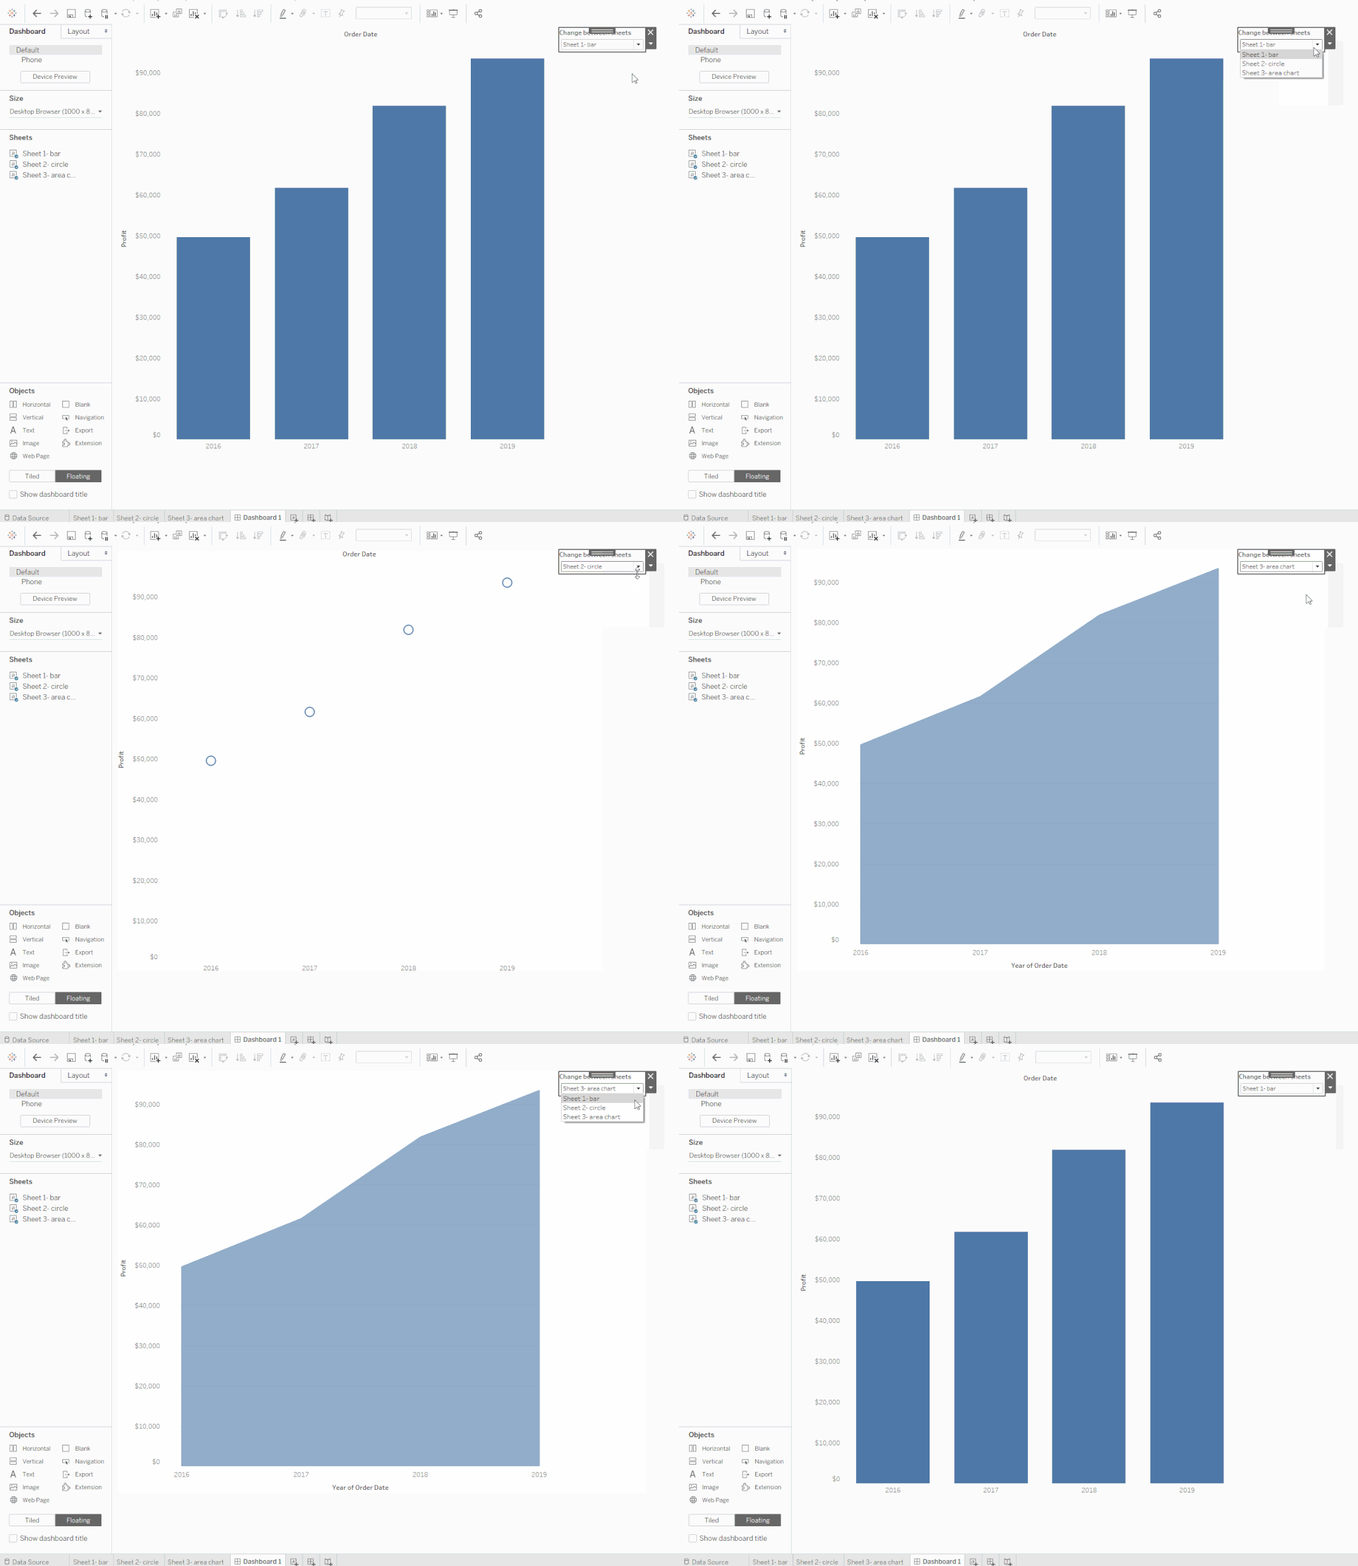
Select the floating button at the bottom of the Dashboard card and drag the first sheets onto the dashboard in the position you’d like to see it. Then remove the title of the dashboard. Do this for each sheet, seemingly stacking them on-top of each other in the exact same position in the dashboard.
Personally, I like to decide on where the visualization would be and note the coordinates and size (in pixels) beforehand.
One sheet should be displayed with each parameter selected.
And you’re done!

Here is the link to the visualization above. It’s downloadable if you’d like to pick it apart!
Thanks for reading, if you have any questions or comments please leave a comment below or contact me on Twitter @vikb03

