


One concept I always struggled to fully understand was weighted averages. It’s one of those topics people often say is “obvious,” but it never really clicked for me at first.
I realized I didn’t just want to know how to calculate it, I needed to truly understand why it works. That clarity made a huge difference when applying it in tools like Tableau and other data analytics platforms.
If you’ve ever felt the same way, this breakdown is for you.
Let's start simple. Imagine you took three quizzes and this is what you scored.
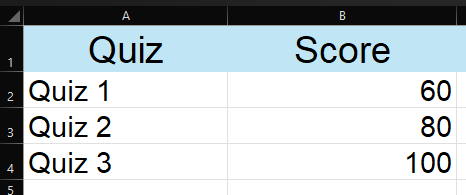
Your average score is (60 + 80 + 100) / 3 = 80. Easy. Every quiz counts the same.
That's a simple average. It works great when every value deserves equal importance.
So What's a Weighted Average?
A weighted average is what you use when some values matter more than others.
Let's say those same quizzes are worth different amounts of your final grade:
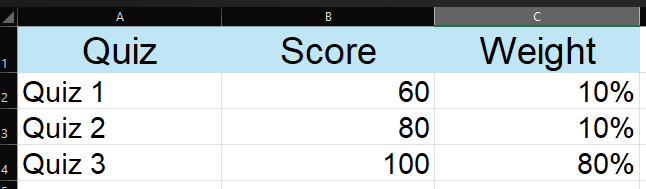
Quiz 3 is worth 80% of your grade. From before if we used a simple average, you'd get 80, but that totally ignores the fact that Quiz 3 matters way more.
The weighted average gives you the real picture:
(60 × 10%) + (80 × 10%) + (100 × 80%)
= 6 + 8 + 80 = 94
Simple average: 80.
Weighted average: 94.
That's the whole idea. A weighted average lets the more important values have more say in the final result.
Another Real-World Example
Let's say you work at a coffee shop and you're tracking customer ratings. You have two locations:
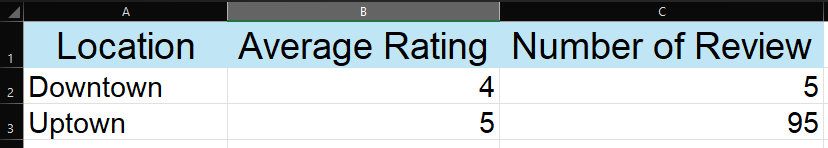
Simple average: (4.0 + 5.0) / 2 = 4.5
But wait! Uptown has 95 reviews and Downtown only has 5. A simple average treats both locations as equally important, which isn't really fair.
(4.0 × 5) + (5.0 × 95)
= 20 + 475
= 495 ÷ 100 reviews total
=4.95
The weighted average (4.95) is much closer to the Uptown score because Uptown had far more reviews. That's a more honest picture of how the business is really doing.
How to Do This in Tableau
Tableau makes this straightforward once you know the pattern. You just need two calculated fields and then combine them.
Using our coffee shop example, let's say your data has a [Avg Rating] column and a [Number of Reviews] column.
Step 1: Multiply Rating by Reviews
Create a calculated field called Weighted Score:
SUM([Avg Rating] * [Number of Reviews])
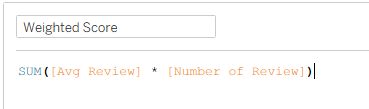
This gives you the numerator, the top half of the calculation.
Step 2: Sum the Reviews
Create a second calculated field called Total Reviews:
SUM([Number of Reviews])
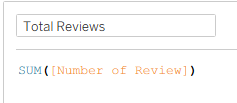
This is the denominator, the bottom half.
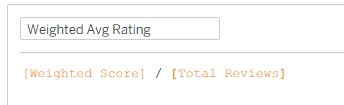
Step 3: Divide Them
Create one final calculated field called Weighted Avg Rating:
[Weighted Score] / [Total Reviews]
Drop that onto your view and Tableau will calculate the correct weighted average across whatever dimension you're looking at, by location, by month, by product, whatever you need.
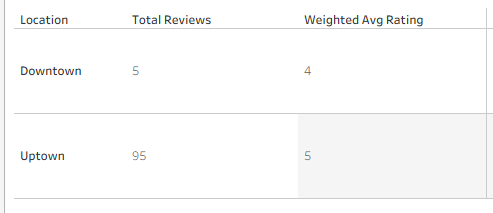
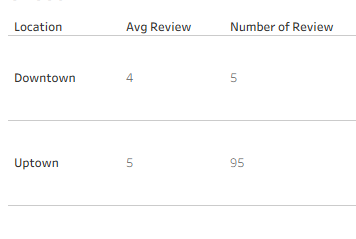
In this screen shot because we have location in the sheet, we will see the split of downtown and uptown amount of reviews and the weighted avg rating for those locations. But to see the performance of the coffee shop we want to know the avg rating across all locations.
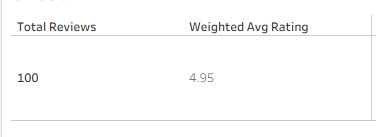
If we get rid of location, we see that the total reviews add up to 100 and the average rating across all locations to be correct, the 4.95 that we had previously calculated!
The Quick Summary
- A simple average treats everything equally
- A weighted average gives more importance to values that matter more
Once this clicks, , you might start to notice when someone is accidentally using a simple average when they shouldn't be. That's a genuinely useful skill to have in your toolkit.
Thanks for reading!