


This blog is about wrapping my head around the functions in Power BI. At the moment I can figure out what functions I can use but I'd love to be at a point where I just write measures without going through the list of what's what in my head first.
CALCULATE
In the order of operations, slicers and filters come before DAX measures. CALCULATE helps create measures that ignore or redefine those filters which is great for creating percentages of overall values or for conditional totals.
Example 1
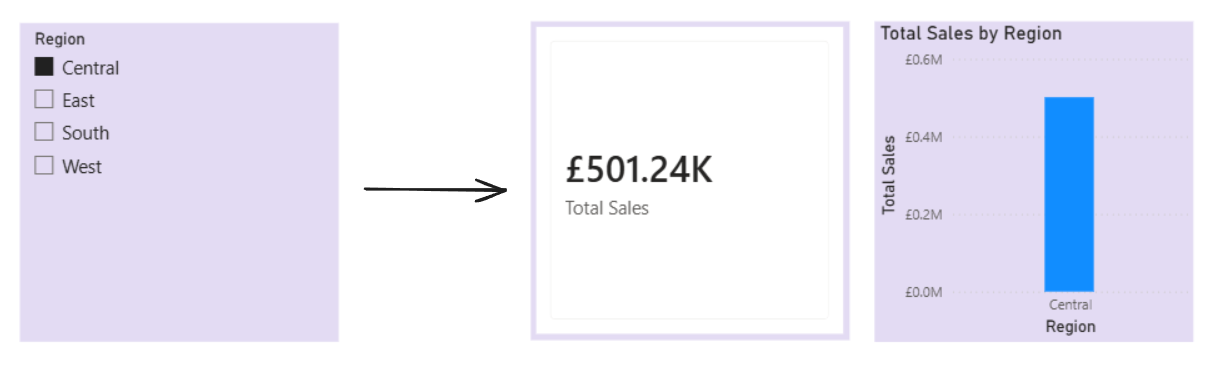
The SUM of sales would return the total sales depending on what filters are applied, such as Central Region. So in the example below, the KPI and bar chart are both showing the total sales for just the Central Region.
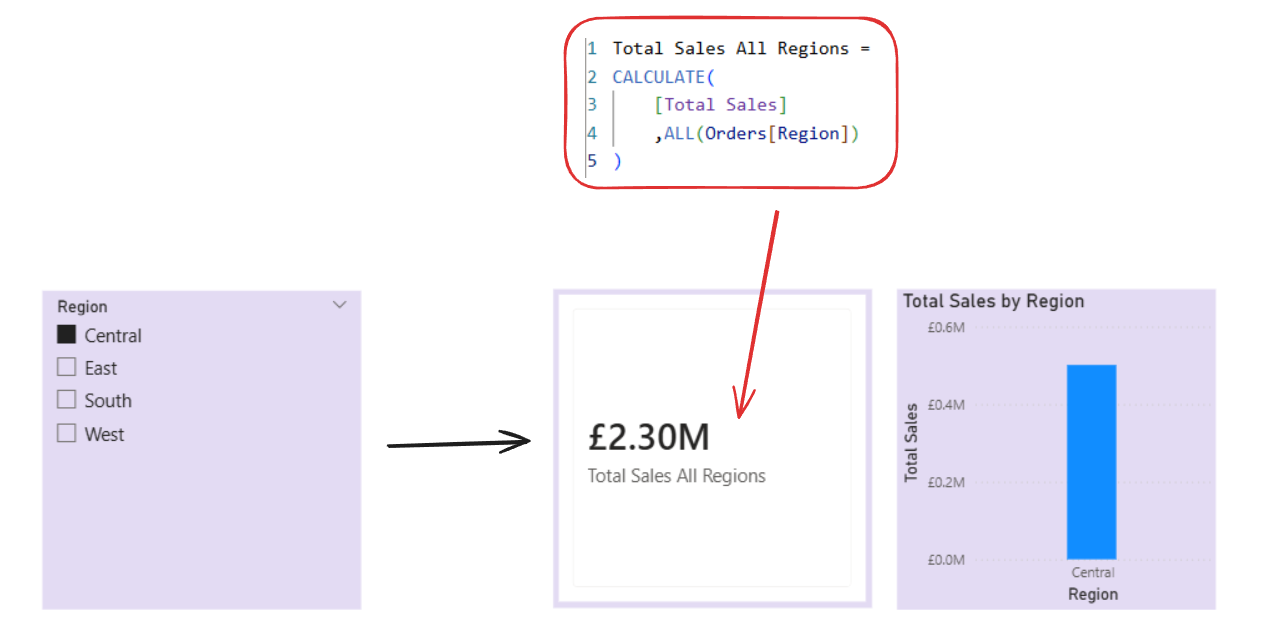
If we wrap a CALCULATE around it, that would change what's returned for example it could ignore Region overall. So now the KPI is showing the Total Sales for every Region regardless of the slicer still filtering to Central.
Example 2
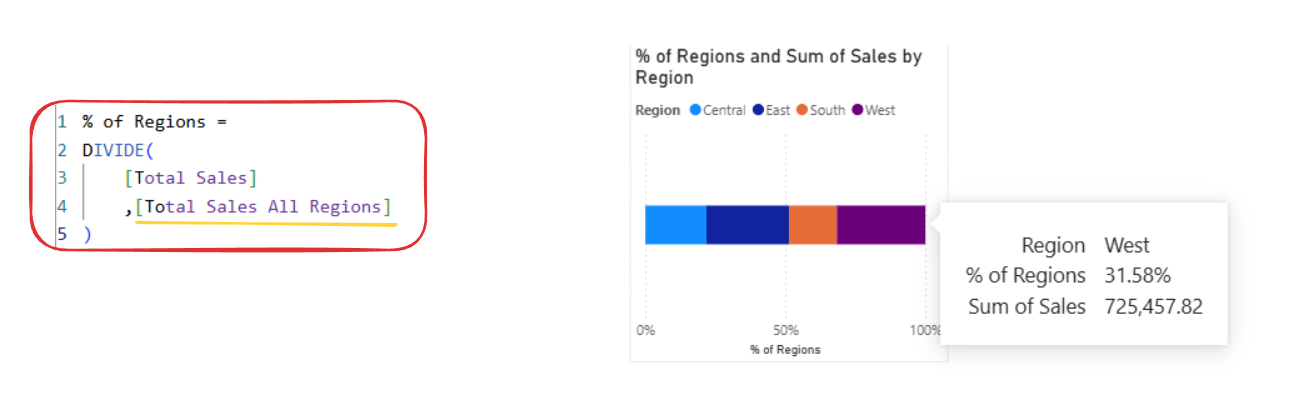
CALCULATE is also useful for creating percentage of overall values. Even though there's a % of GT option, creating measures for these are really useful if you need to use it repeatedly.
SUMX
SUM vs SUMX makes more sense to me now! SUMX calculates at the row level before aggregating whereas SUM just adds up the values in a column.
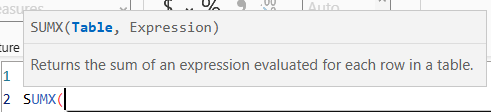
So for SUMX we want to refer to the table first and then write our expression.
Example
If we wanted to work out Total Profit we would want the SUM of "Sales - Cost". We can't do that with just SUM which is where SUMX comes in with the row-by-row calculations and then it adds those up.
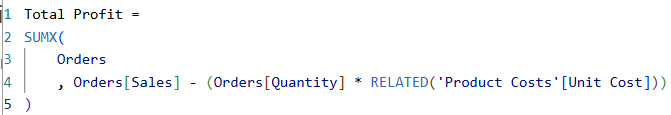
So this measure is saying, for each row in the Orders table, calculate the Sales - Cost (cost being quantity multiplied by unit cost).
The RELATED function is bringing in Unit Cost from the Product Costs table based on a relationship.
RANKX
RANKX basically ranks items by evaluating each one in a table and then putting them in order (either ascending or descending).
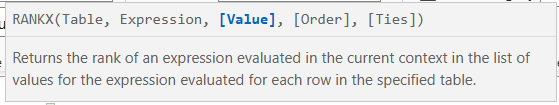
We want to refer to the table - what we're ranking.
Then the expression - what we're ranking by.
Value, order, and ties are optional (the measure will work without these). Value is the value to rank.
Order is ascending or descending (it will default to ascending)
And ties decides what to do when there are two or more items with the same value. You can SKIP which is the default, or you can choose DENSE which leaves no gaps in the ranking.
Example
If we wanted to Rank Regions by Sales we could say for the Orders table, rank the Region by Total Sales, in descending order.
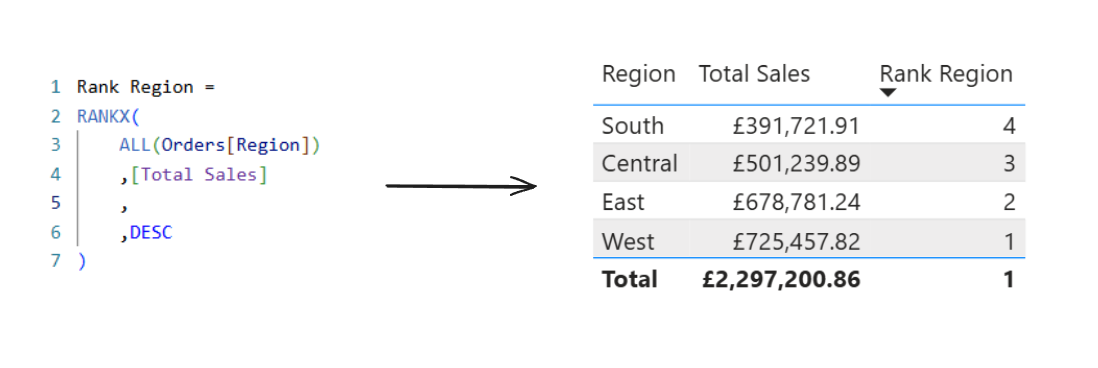
And as you can see we can now see the ranking for each region.