


Week 7 is here!! Today's blog runs through the Workout Wednesday we did today (WOW2022 W22) which has been really satisfying to build.
PLAN
So we know we need 4 charts which need to be ranked, and we also need a 'player parameter'.
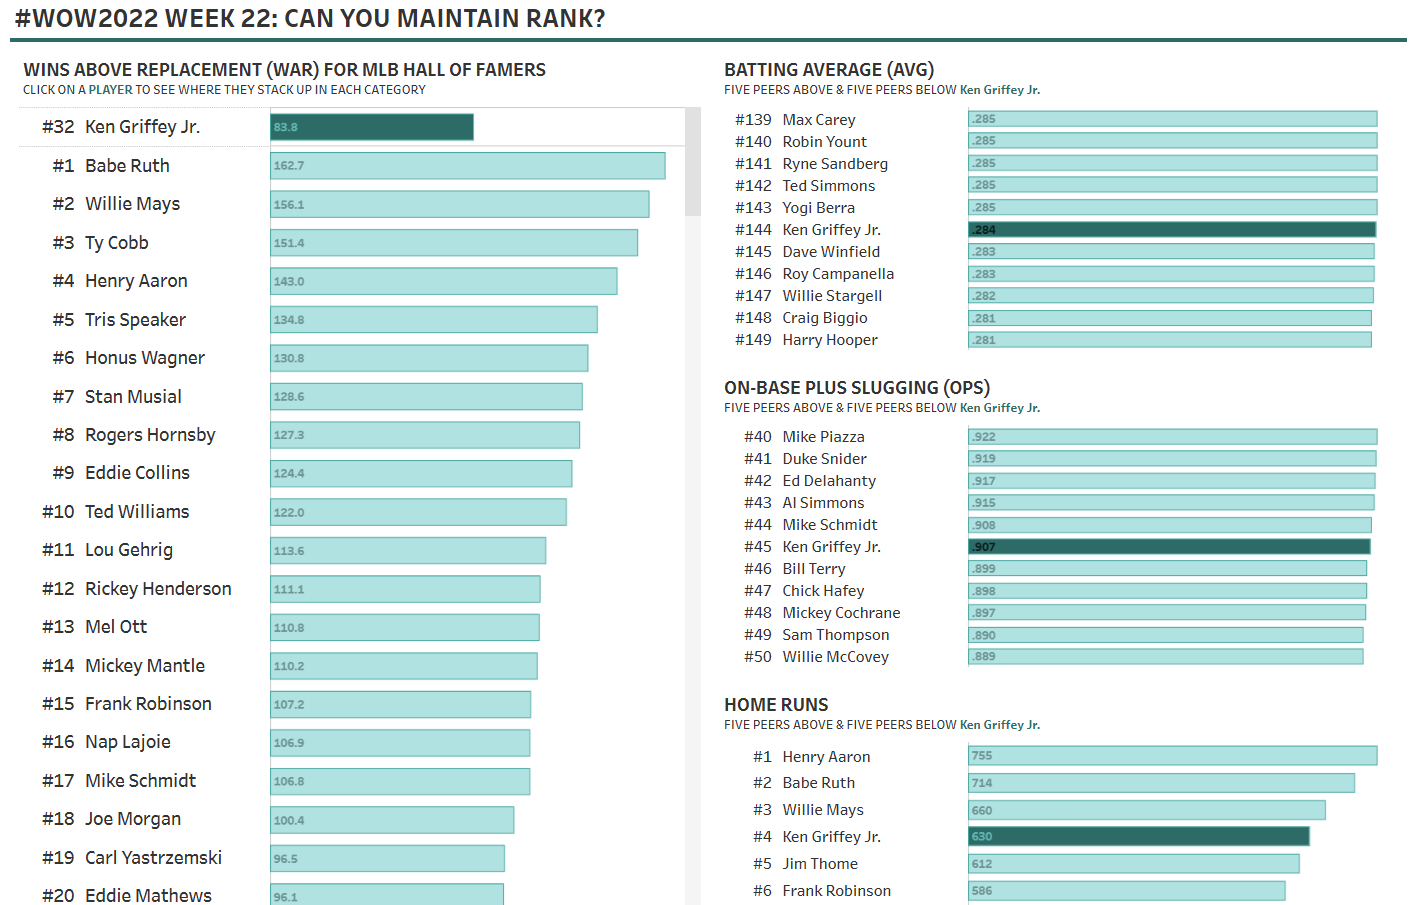
Chart 1 - Wins Above Replacement we want to see the players ranked in descending order, and the selected player should be highlighted and moved to the top.
Charts 2 to 4 - we need their names and the stats for each category. We also want to rank these charts and the chosen player should be highlighted whilst showing the 5 peers above and below them.
STEPS
Player Parameter
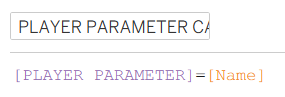
1 - Create a parameter "PLAYER PARAMETER" and change the data type to a string.
2 - Then create your boolean calculation to go with that "PLAYER PARAMETER CALCULATION" to say when parameter = name then true
which can then be added to colour on all the charts.
Chart 1 - Wins Above Replacement (WAR)
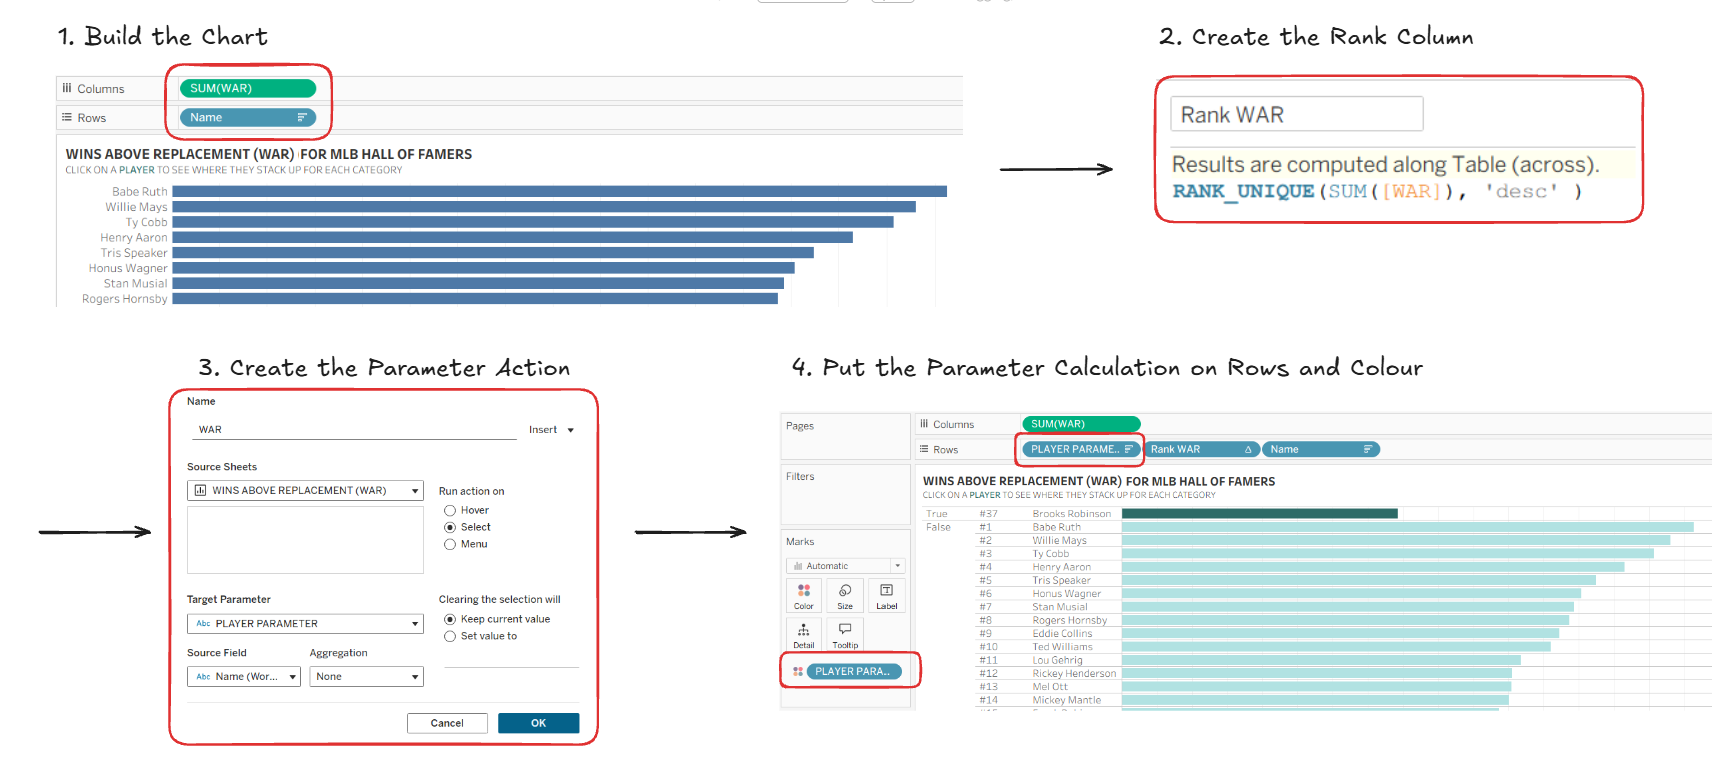
1 - To build the basic chart we would add the WAR stats on columns, and the player's name on rows.
2 - Then create a rank calculation (called Rank WAR in this example) using RANK_UNIQUE which will prevent any duplicate numbers if two players have the same stats. This needs to be discrete (blue) then put this on rows.
If it's left as continuous you won't be able to put this on rows before "Name" because you can't put green before blue.
3 - Create a Parameter Action so that the user can select a name.
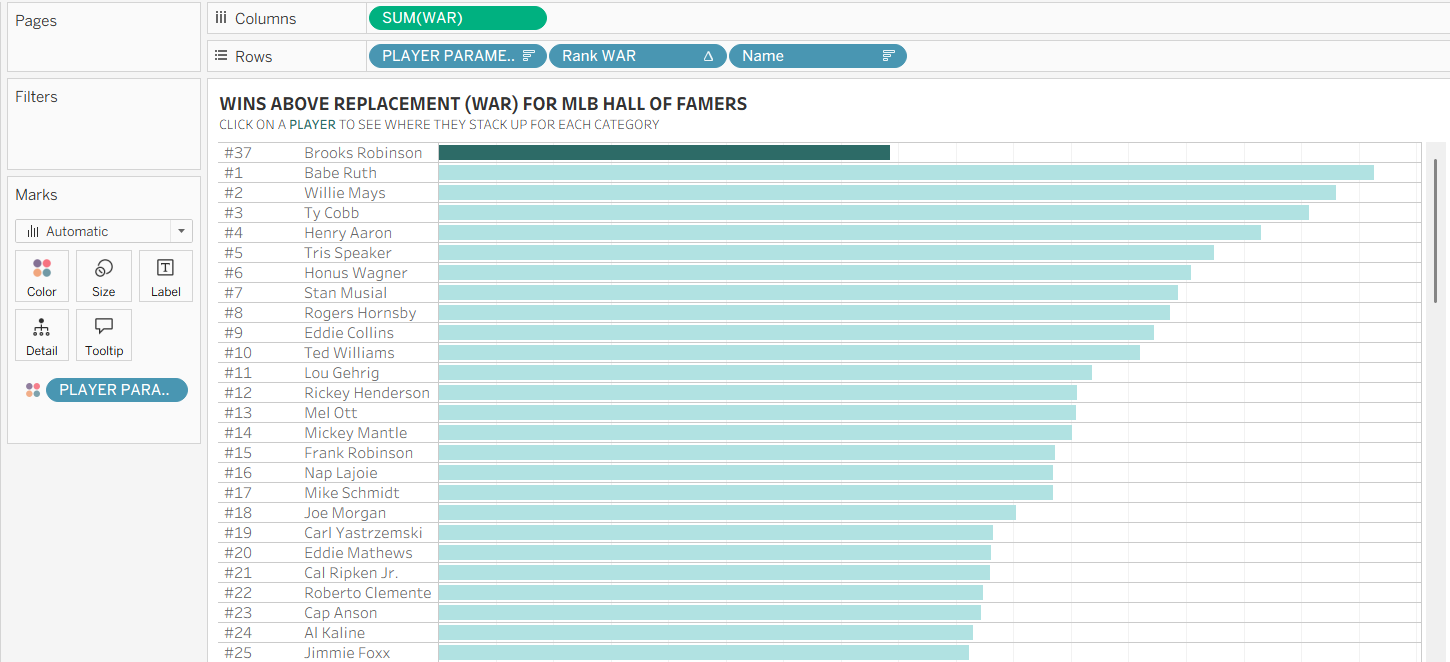
4 - Put the PLAYER PARAMETER CALCULATION onto both colour and rows - make sure you sort this so TRUE is at the top.
5 - Hide the headers and the first chart should look like this:
Charts 2 to 4
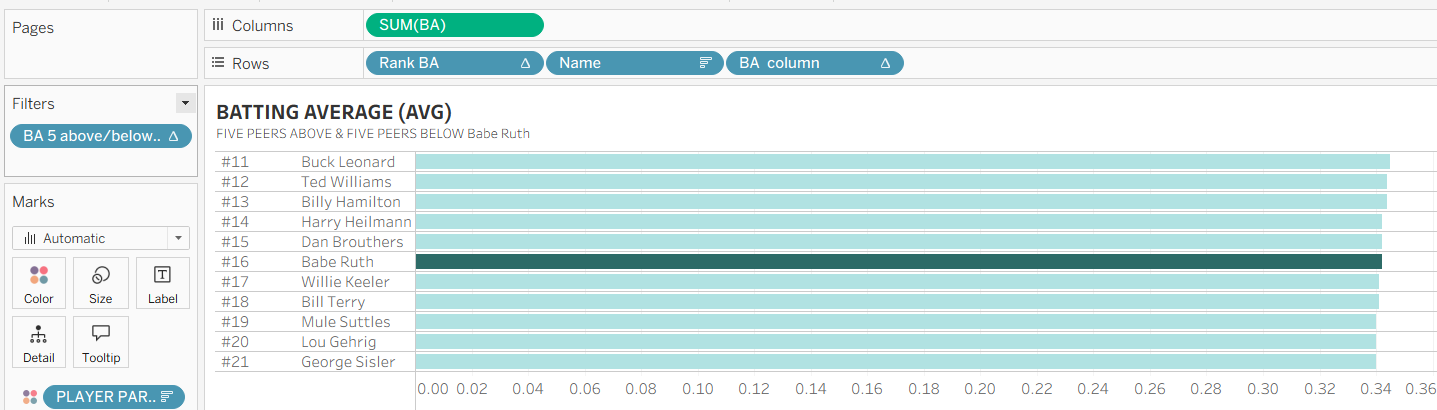
The following steps are for Batting Average (BA) but these charts will all be built the same way just using the different stats (Batting Average, On-Base Plus Slugging, and Home Runs).
1 - This chart starts the same as the previous chart, put BA stats on columns, and the player's name on rows.
2 - Then create another rank calculation using RANK_UNIQUE (make sure it's discrete) and put this on rows.
This ranks the players by their stats but we need to create another column with the selected player's rank, so that we can create a calculation later to work out the 5 players above and below.
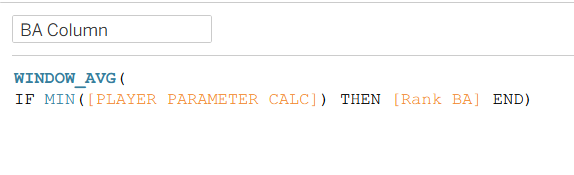
3 - To create said column, in our calculation we'd want to say IF the parameter calculation (is TRUE) then return the selected player's rank.
We then have to wrap all of that in a WINDOW_AVG (doesn't have to be average) but the window function is a table calculation that works with what's within the window. Mine looks like this:
Then put this in rows and it should look like this:
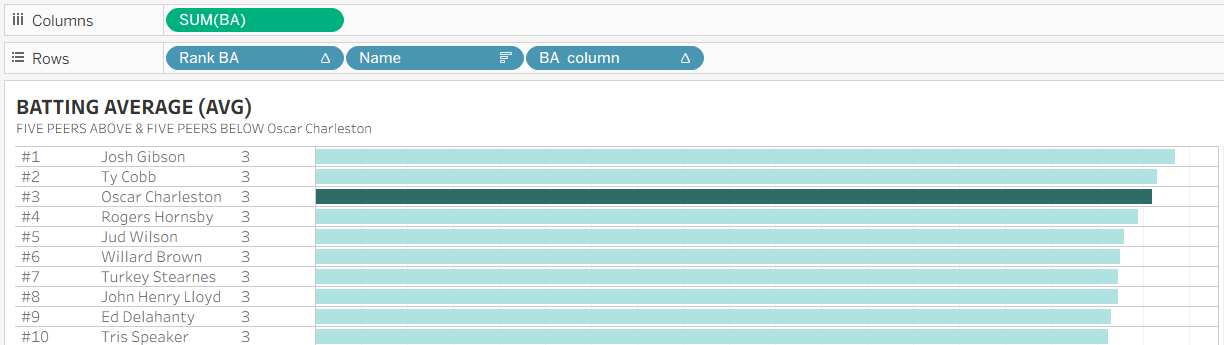
So as you can see, the selected player is third, and the new column is returning 3 for every row.
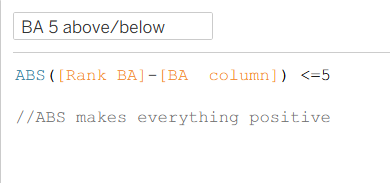
4 - Now we can create our above or below calculation.
5 - Create a Parameter Action so that the user can select a name.
6 - Put the PLAYER PARAMETER CALC onto both colour and rows - make sure you sort this so TRUE is at the top.
7 - Put the "5 above/below" calculation from step 4 into filters and tick "True"
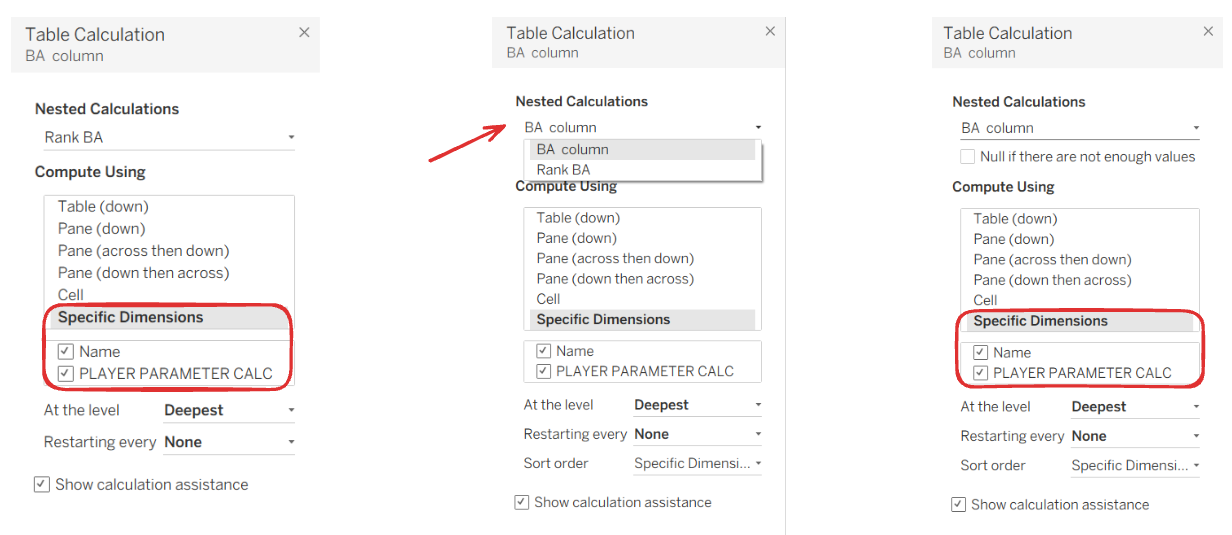
8 - Right click to check your table calculations. Under "Specific Dimensions" both Name and the Player Parameter Calculation need to be ticked so that the rank doesn't reset for every name/player. Make sure you check both table calculations (both BA column and Rank BA in this case).
8 - Hide the headers and the chart should look like this:
Then we have to repeat this two more times for the other two charts. Once everything is done it will look like this!
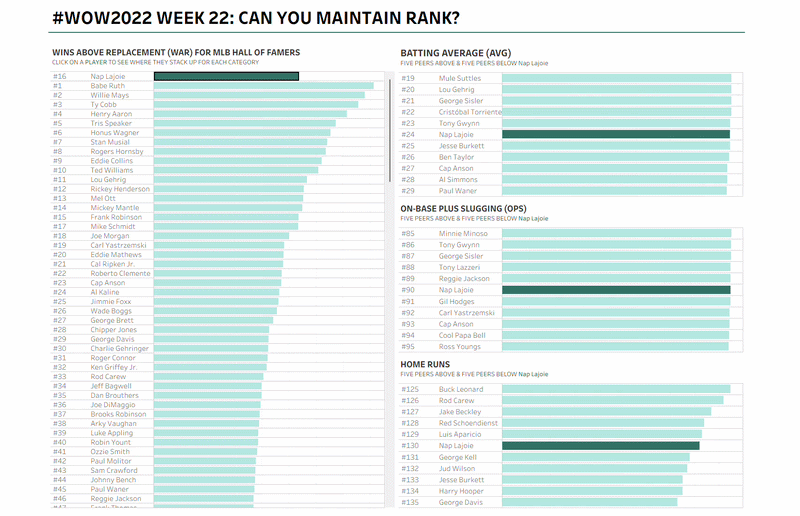
So for the first chart it will bring your selected player to the top and show their rank. For the three charts on the right, it will show that selected player and the 5 players ranked above and below them. The parameter is linked to all the charts so you can select on players on whichever chart you like and it will change the whole dashboard!