


Dashboard Week is all about speed and precision. Each morning we’re handed a brand-new task, and we’ve got until 3:30pm to wrangle it, prep it, visualise it, and present our findings.
The rules are simple:
- Work independently (unless told otherwise).
- Sketch your dashboard idea before you build it.
- Publish your viz to Tableau Public or Power BI Service.
- Write a blog about your process, challenges, and findings.
- Present our work.
Today’s Task
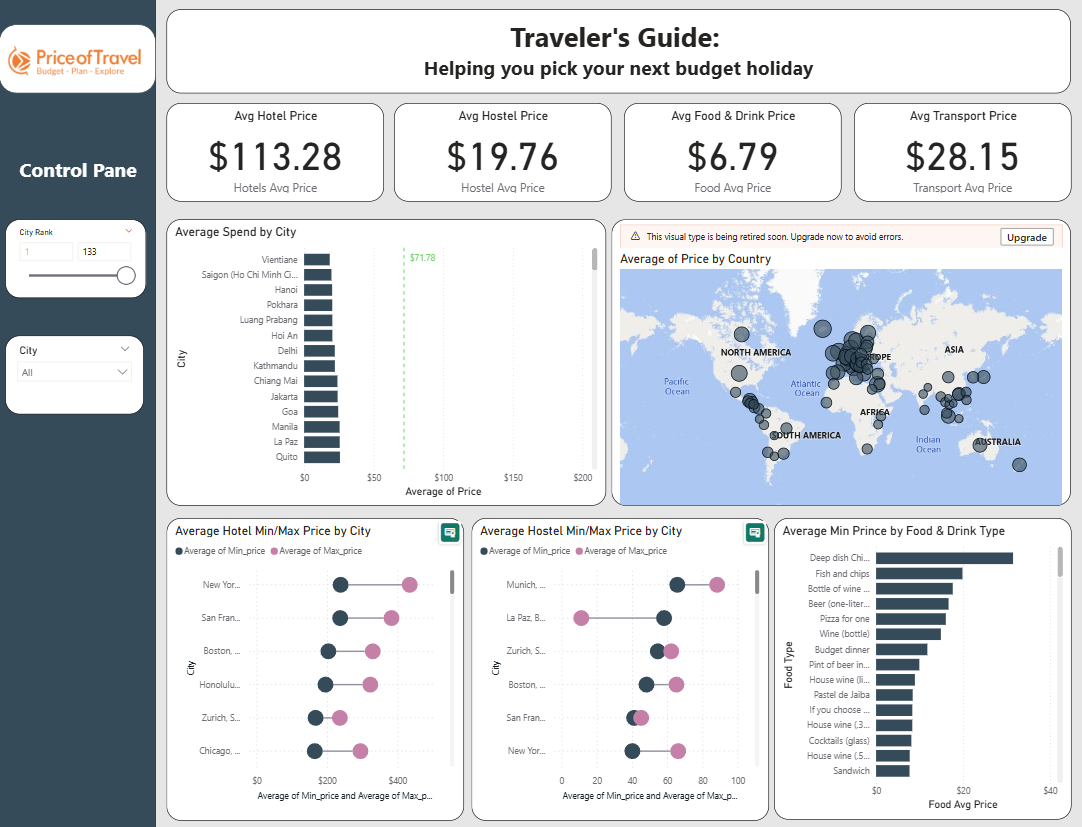
We were asked to scrape travel cost data from the Backpacker Index to help travellers uncover the best value destinations around the world. The job was to:
- Scrape the main Backpacker Index page.
- Scrape each city’s detail page (those handy tables of hotels, food, transport, etc.).
- Build a dashboard in Power BI.
- Share our plan, the challenges, any surprises, and embed the finished dashboard in our blog.
Step 1 – Grab all the city URLs
The main “cheapest places” page lists all 133 destinations, but the details live on separate pages (like Amsterdam, Bangkok, Athens etc.). So the first thing I needed was a table of all those links.
I used Power BI’s Get Data ▸ Web to bring in the HTML, split it into rows, and extracted everything between <a href=" and " that ended with -price-guide. After a quick clean-up, I had a nice table with all 133 URLs. One URL link per city.
Step 2 – Build a sample city query
Next, I picked one city URL (say Amsterdam) and connected to it through Get Data ▸ Web again. On that page, Power BI’s Navigator showed me tables like Hotels, Food & Drink, Transport, etc. I ticked them all and loaded them into Power Query.
At this stage, they were just hard-coded to Amsterdam. But the trick is to make them dynamic.
Step 3 – Turn them into functions
I created a parameter called pCityUrl, then swapped the hardcoded Amsterdam link for that parameter. Now, whenever I change the parameter, the query pulls whichever city I want.
Right-click -> Create Function and suddenly my Hotels query became a reusable fnHotels function, my Food query became fnFood, and so on.
Step 4 – Run the functions on all 133 cities
Back to my CityUrls table: I added a new column, invoked my function, and pointed it to the URL column.
Instead of just Amsterdam hotels, I now had hotels for every city in the list. I then duplicated the table and repeated the same steps for Food, Transport, etc.
Step 6 – Load and explore
After cleaning up, I loaded everything into the model. Now I can:
- Compare food costs across all 133 cities.
- See how hotel and hostel prices scale from city to city.
- Analyse transport costs.
Challenges
One of the biggest challenges I faced during this task was the web scraping itself. Using Power BI’s Get Data from Web seemed simple at first, but I quickly discovered that the HTML didn’t load neatly into tables. Instead, I had to break the page into lines of code, extract links manually, and then figure out how to loop through 133 different city pages. On top of that, some columns came through as text instead of numbers (like prices with dollar signs), which meant I had to clean and convert them before I could do any meaningful analysis. Even once I got the data, ranking and filtering cities by price required building measures rather than columns, which was a tricky shift in thinking at first. It was definitely a test of patience and persistence, but working through these hurdles gave me a much deeper understanding of Power Query, parameters, and DAX.