


Our Brief
For day three, DS52 were tasked with analysing data on UK Street Crimes between July 2024 and July 2025. The challenge was to use this data to build an Alteryx App that would allow the user to pick a specific date range, crime category and area (either using a map interface tool or by typing in a postcode). The app would then update a data source that could be pushed to our Tableau Server, Power BI workspace or even Tableau Public via Google Sheets.
The use case was straightforward. The user runs the app, selects their area of interest and timeframe, and the visualisation updates accordingly. Simple in concept, but it required careful planning and execution.
The data was sourced from data.police.uk, which we made sure to reference before publishing.
Building the Alteryx App
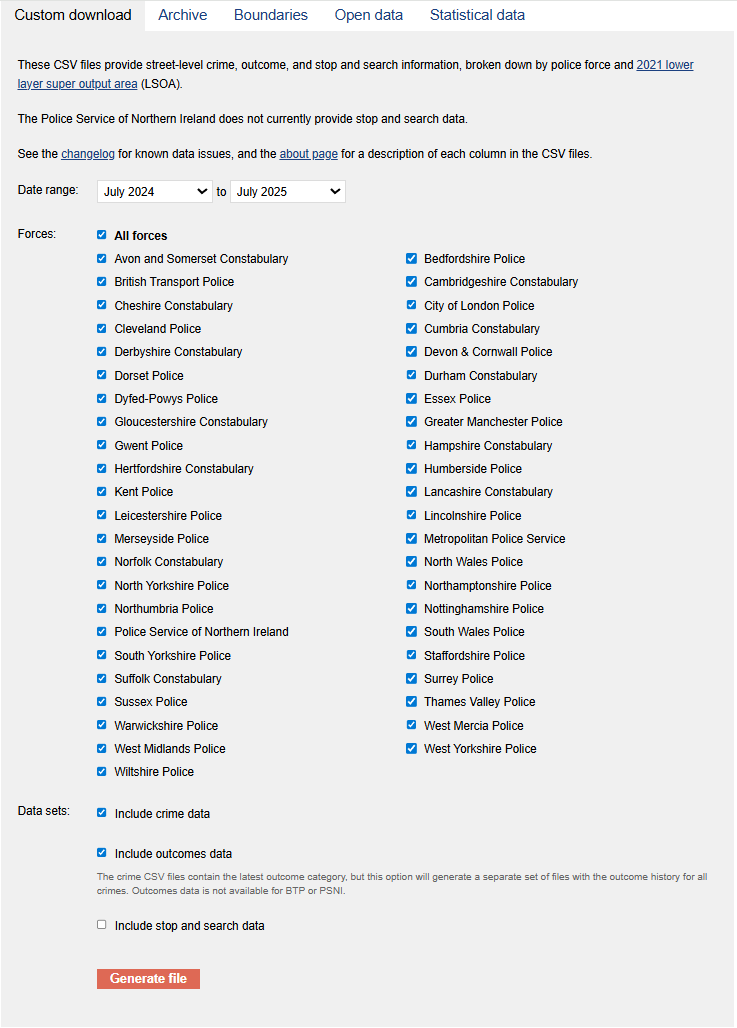
Step one was downloading the data from the Police UK website. This gave me both street-level crime data and outcome data.
Step two involved launching Alteryx and setting up the Directory tool, pointing it to the folder containing all our datasets. This ensured I could process multiple files at once.
Step three was about filtering. I honed in on the outcomes and street data that were most relevant to my use case.
With step four I brought in the Dynamic Input tool, which helped me handle multiple datasets without having to hardcode file names.
Step five and six both used the Union and Unique tool. First I matched on crime ID, and then I removed any duplicate crime IDs to keep the dataset clean and consistent.
Step seven introduced the DateTime tool. Here I parsed out the month column into a proper date field, giving me flexibility to filter by custom ranges later on.
In step eight I used the Select tool to tidy things up. This meant converting some data types and renaming fields so the workflow was cleaner and easier to follow.
Step nine brought in the first Filter tool to apply a date range. For example:
[Date] >= "2024-07-01" AND [Date] <= "2025-07-01"
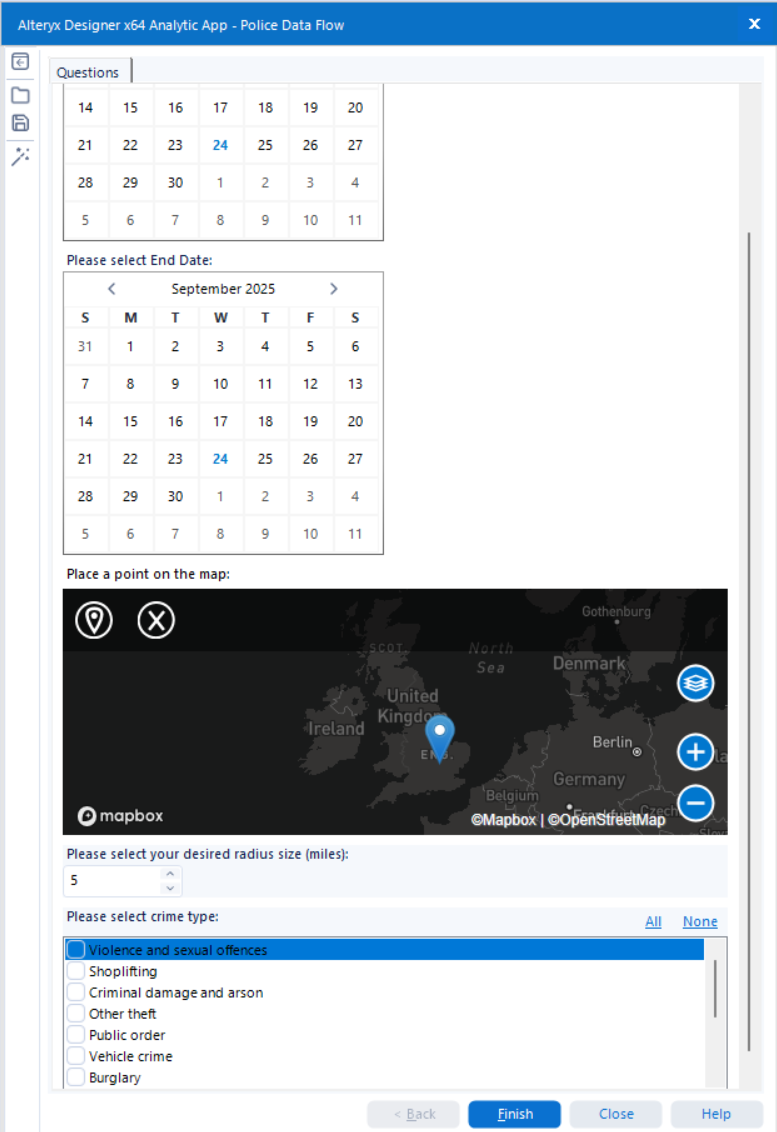
I then set up two Interface Date tools, one for the start date and another for the end date, giving the user full control over the timeframe.
Step ten was a second Filter tool, this time focusing on crime type. I connected this to a List Box from the interface section so the user could choose the categories they wanted to explore.
Step twelve added the spatial elements. Using the Create Points tool, I mapped out all the crimes. Then with the Spatial Match tool, I connected it to a map and radius tool so the user could pin a specific location and type in their desired radius.
Finally, step thirteen involved the Tableau Output tool. This was not included by default in Alteryx, so I had to download and install it separately. Once configured, it allowed me to upload the dataset directly to Tableau Server, ready for visualisation.
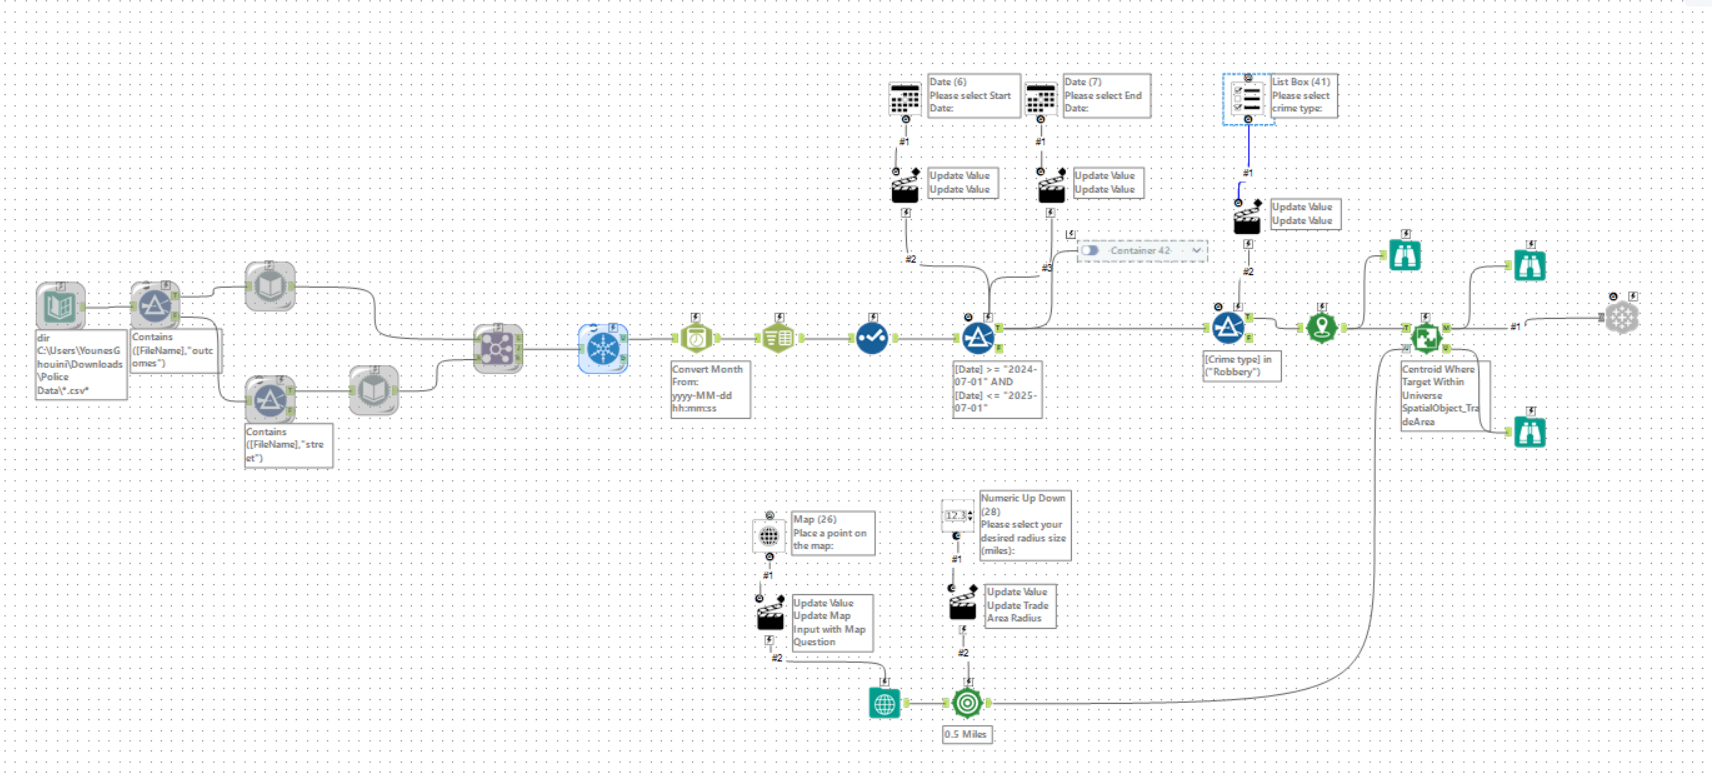
Alteryx Workflow
Here is the final workflow of the Alteryx App:
Final outcome of the App:
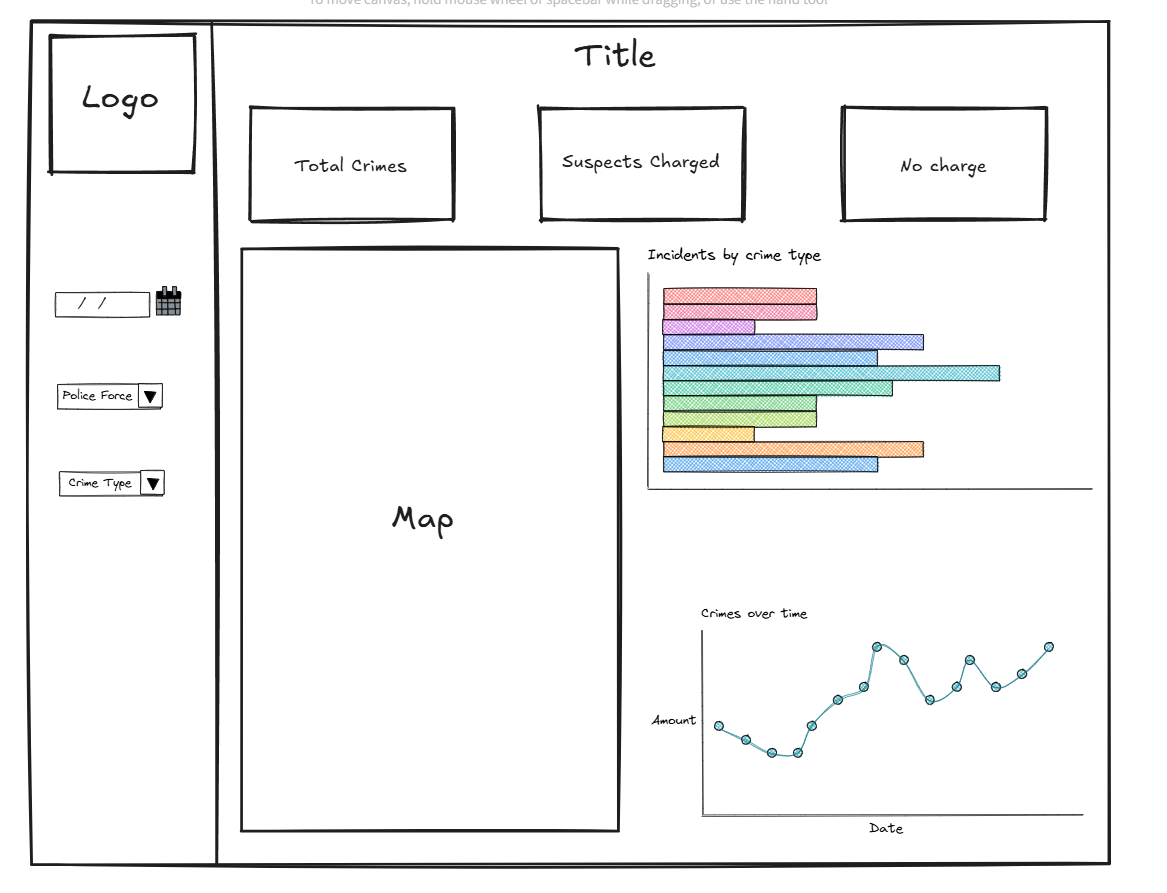
Building the dashboard on Tableau
This was my initial sketch of the dashboard:
This was the outcome of the project. A dashboard built in Tableau and it will update dynamically depending on what is selected within the Alteryx App.
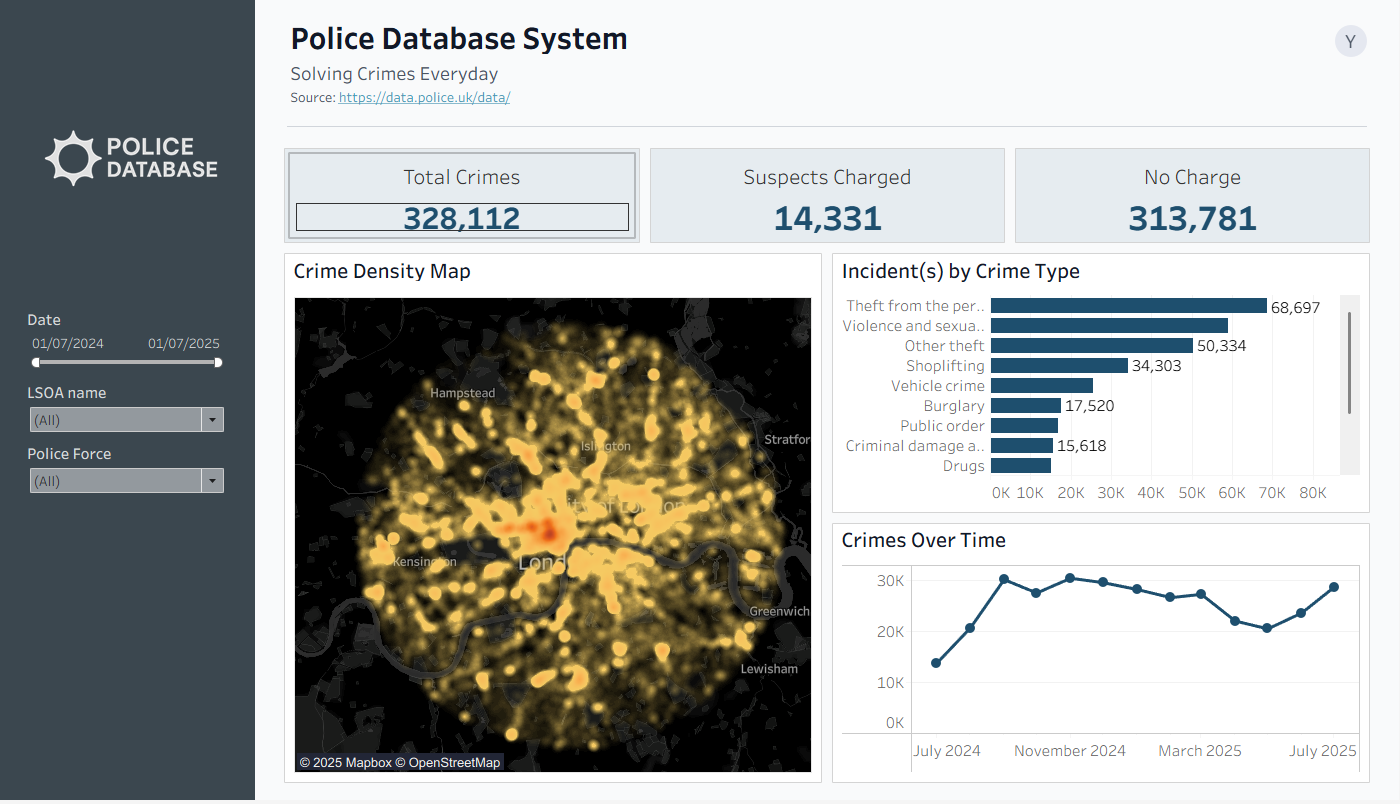
The result was an interactive and flexible tool for exploring UK street crime data in detail.
Click here to check out the final dashboard on Tableau Public