


When working with data one of the most powerful tools we have is statistics. Stats help us make sense of numbers, spot patterns and draw conclusions that go beyond what is visible at first glance. In this post we will look at some common ideas in stats and how they apply to data work.
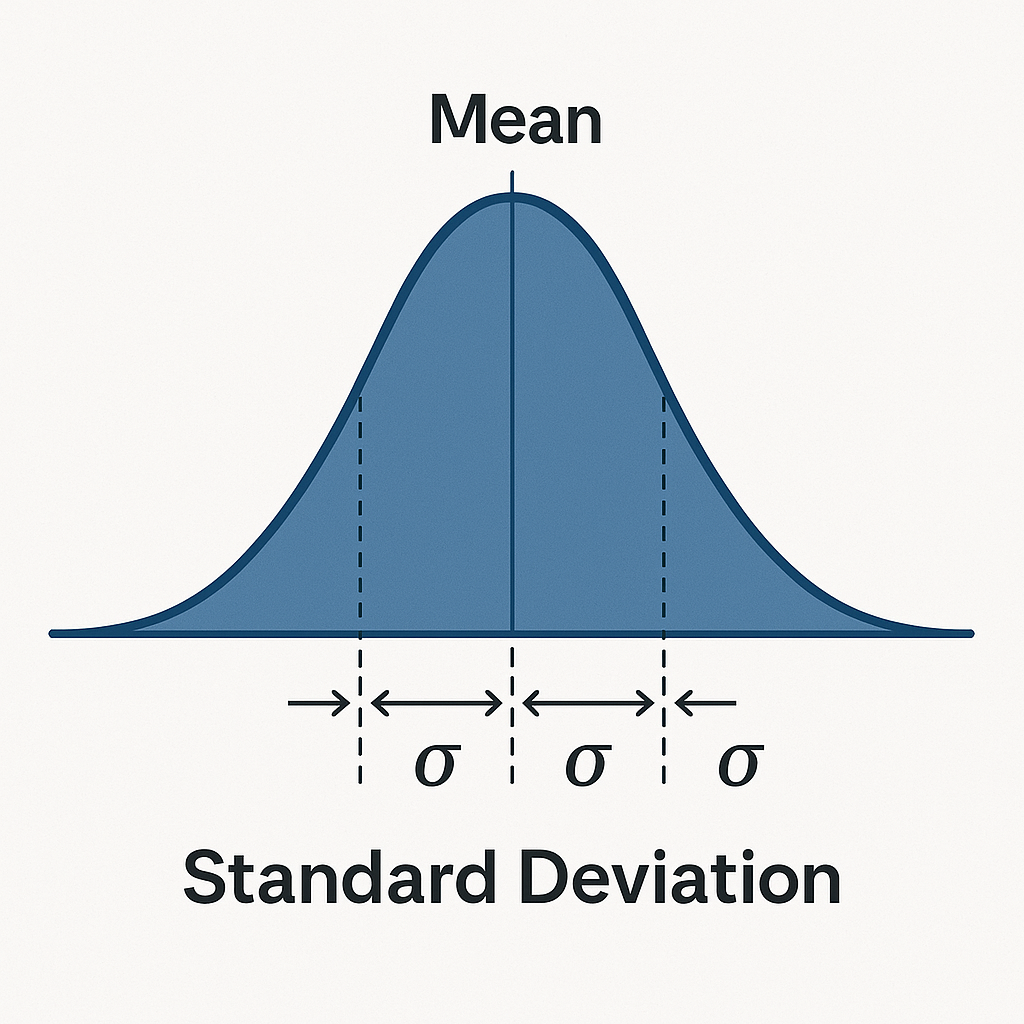
Standard Deviation
The standard deviation is a way of showing how spread out the data is from the average. If the standard deviation is small it means most numbers are close to the average. If it is large the numbers are more spread out. For example if exam scores in a class have a low standard deviation it tells us that most students performed at a similar level. In business a low standard deviation in sales may suggest a stable market while a high one might show that demand is unpredictable.
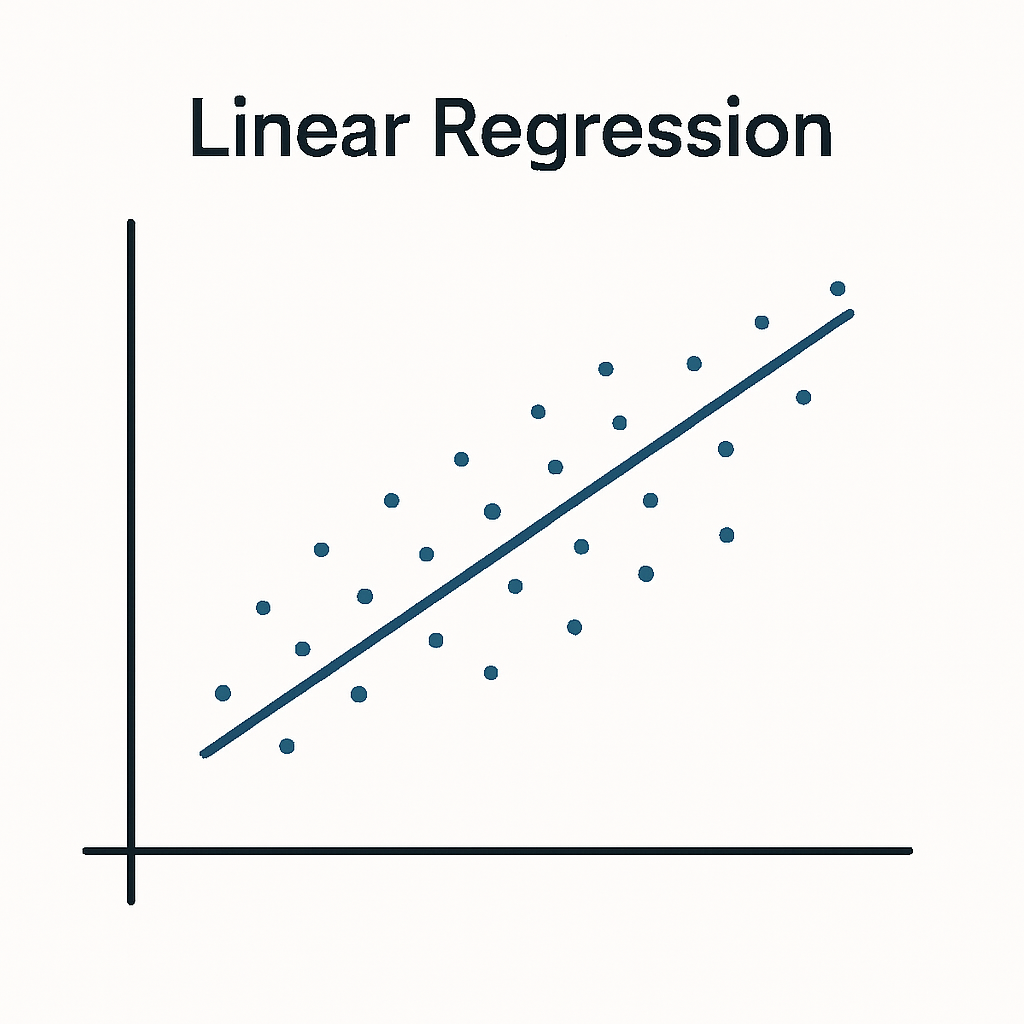
Linear Regression
Linear regression is used to find relationships between two sets of numbers. It fits a straight line through the data points to show how one variable changes as the other changes. For instance we might look at the link between advertising spend and revenue. If the line slopes upwards it suggests higher spending is linked to higher sales. In everyday analysis regression helps us forecast, compare measures and make better decisions.
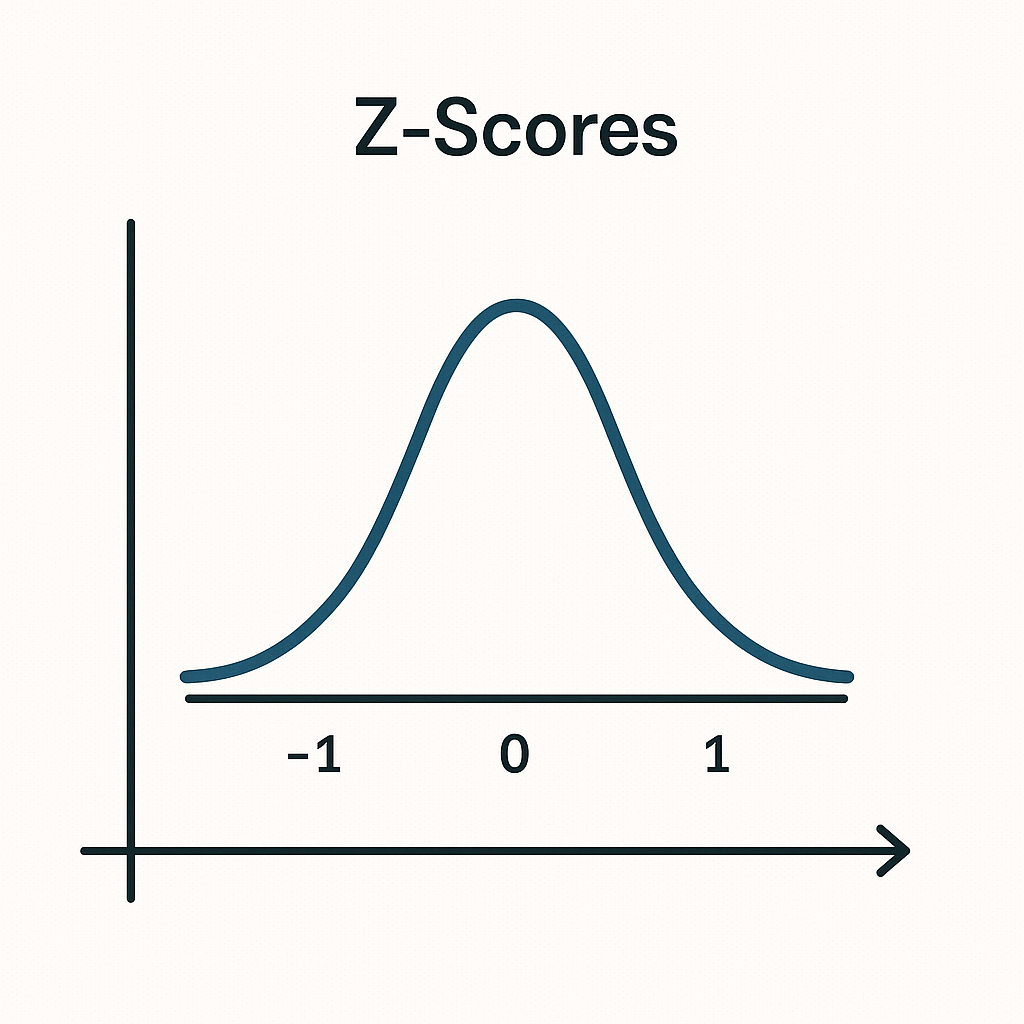
Z-scores
The Z Score tells us how far a number is from the mean in terms of standard deviations. A z score of 0 means the value sits exactly at the mean. A positive z score means the value is above the mean, while a negative one shows it is below. If the z score is very high or very low it could point to a value that is unusual in the dataset. Analysts often use z scores to compare numbers across different scales, like test results from papers with different mark ranges.
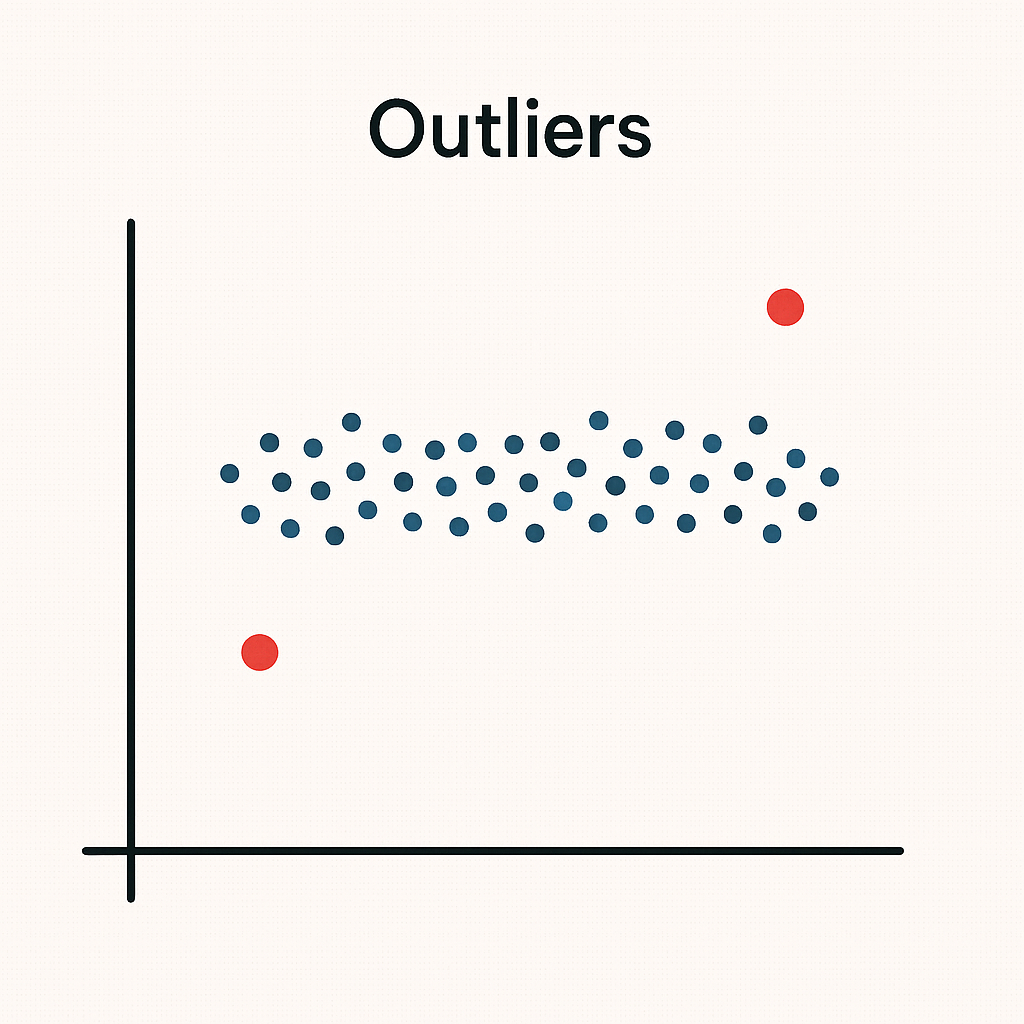
Outliers
An outlier is a number in the dataset that is very different from the rest. It may represent an error, such as typing an extra zero in a sales report. It may also represent a genuine rare case, such as an unusually large one-off order. Outliers are important because they can affect averages, trends and models. When spotted, the analyst must judge whether to keep them, explain them or remove them depending on what the analysis is for.
Bringing it all together
All of these ideas work together when dealing with data. Standard deviation and z scores help us understand the shape of the data. Linear regression lets us look for relationships. Investigating outliers ensures results are reliable. These are the building blocks of statistical analysis and they allow us to move from raw numbers to insights that support decisions.