


These past couple of days DS 33 has been learning all about parameters and the actions they can perform while in Tableau. One of these actions is the ability of switching measures, dimensions or more, for a view on the fly.
To see how this can be done, I'll be referencing everyone's favourite data source - Superstore.
Let's say that we wanted to see the sales, profit and discount of each sub-category. To do this, we'd firstly drag Sub-Category onto rows, before then creating a parameter that looks like the following:
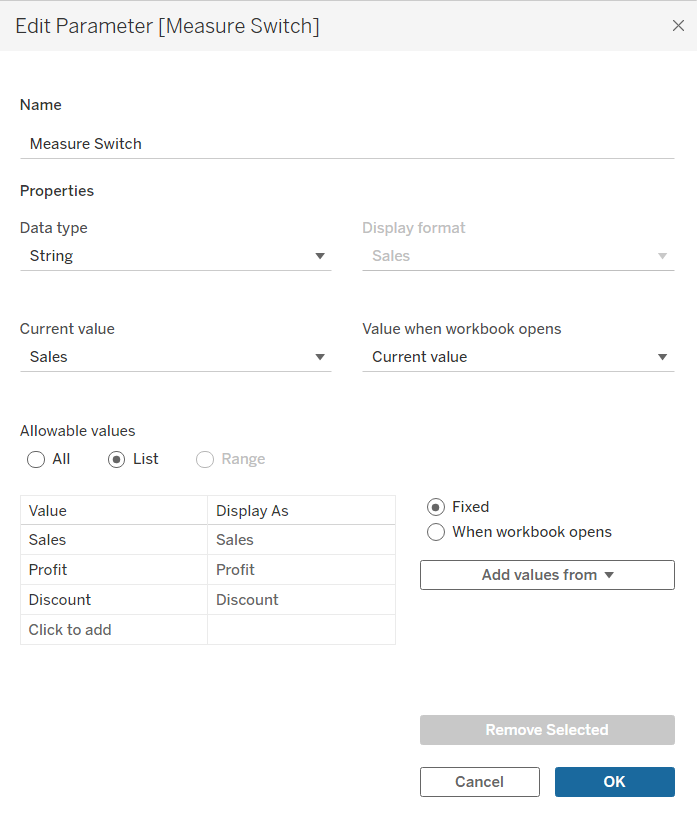
This parameter will play a more aesthetic role for us. It's going to be looking at those three categories of Sales, Profit and Discount, providing us with a dropdown menu that will allow us to choose one of the three to look at and how Sub-Categories interact with such measures. It's important to note here that the spelling of those three categories in the parameter is extremely important, as it plays a pivotal role in the next step.
Then we get onto the more annoying/strenuous but certainly satisfying part of Tableau - calculated fields.
In order for that parameter to have a functional role, instead of the aesthetic role it plays currently, we'll need a calculated field to initiate the changing of measures between the three we've chosen.
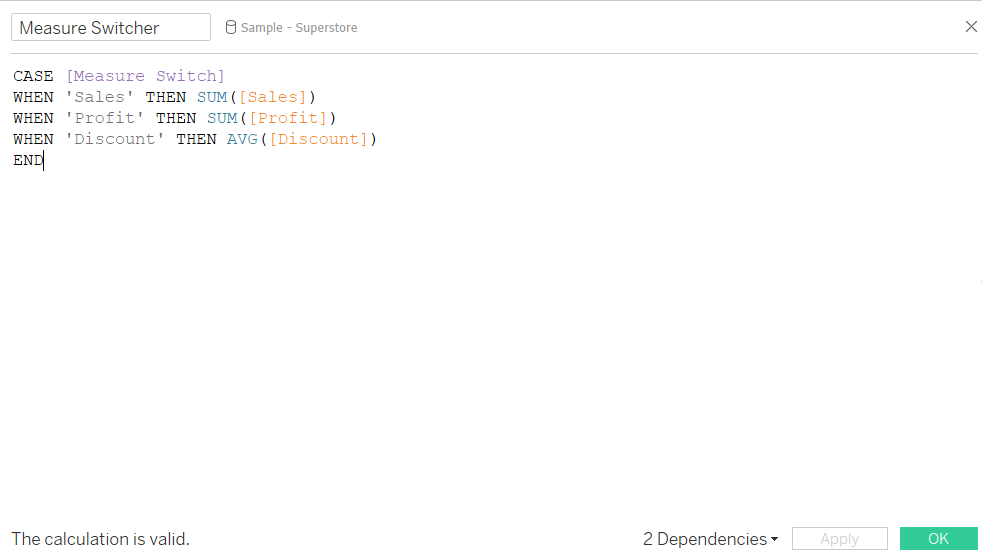
The calculated field here uses a 'CASE' statement, which can be best described as 'like an IF statement but less annoying' - thanks Nermine! The field is stating that when 'Sales' (note how it is exactly like how we spelt it in the parameter) is selected in our 'Measure Switcher' parameter (which can be identified due to its' purple colour), then the SUM of Sales will be displayed. This applies to the next two fields, with for Discount the Average being used instead of SUM as we don't want all the discounts added up, but rather just the average discount used for each Sub-Category.
Success in this area and hopefully with no red squiggly lines underneath any part of your calculated field will allow you to then drag the calculated field to the columns, finally providing some detail to your view. By right-clicking and pressing show parameter on our parameter that we made in the beginning, we'll be able to toggle between each three measures and see how the view changes accordingly.
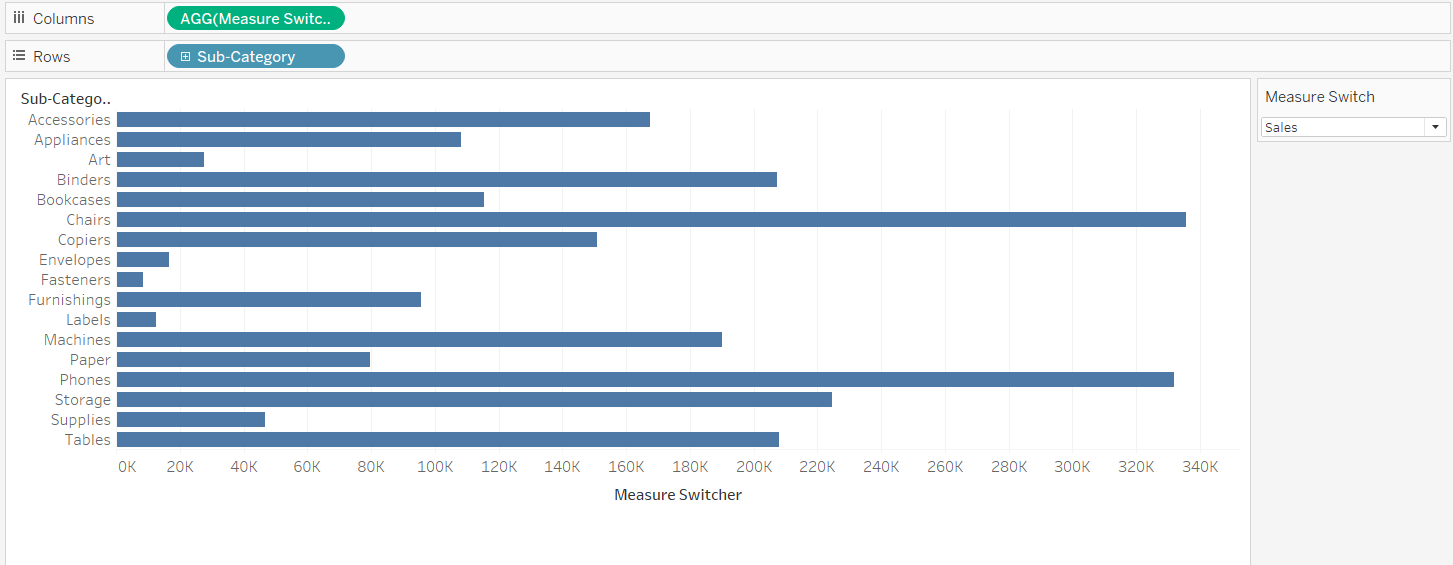
Additionally, you can drag the parameter in front of the measure switcher calculation on the columns to provide a header on the view itself, rather than in the shown parameter on the side. This method can be applied to creating switchers for both dimensions and measures, and even with some extra steps, charts and highlighting functions.
This technique can be super helpful with providing an extra level of analysis and I'm sure if you show it off to friends and family who are uninitiated with Tableau, they'd think its cool. But showing it off to people who are just getting started with the software, or even in an application to the Data School, now that's where the brownie and/or style points are gained.