Breif:
- Scope: Analyse UK street crimes July 2024 → July 2025 (crime data + crime outcomes).
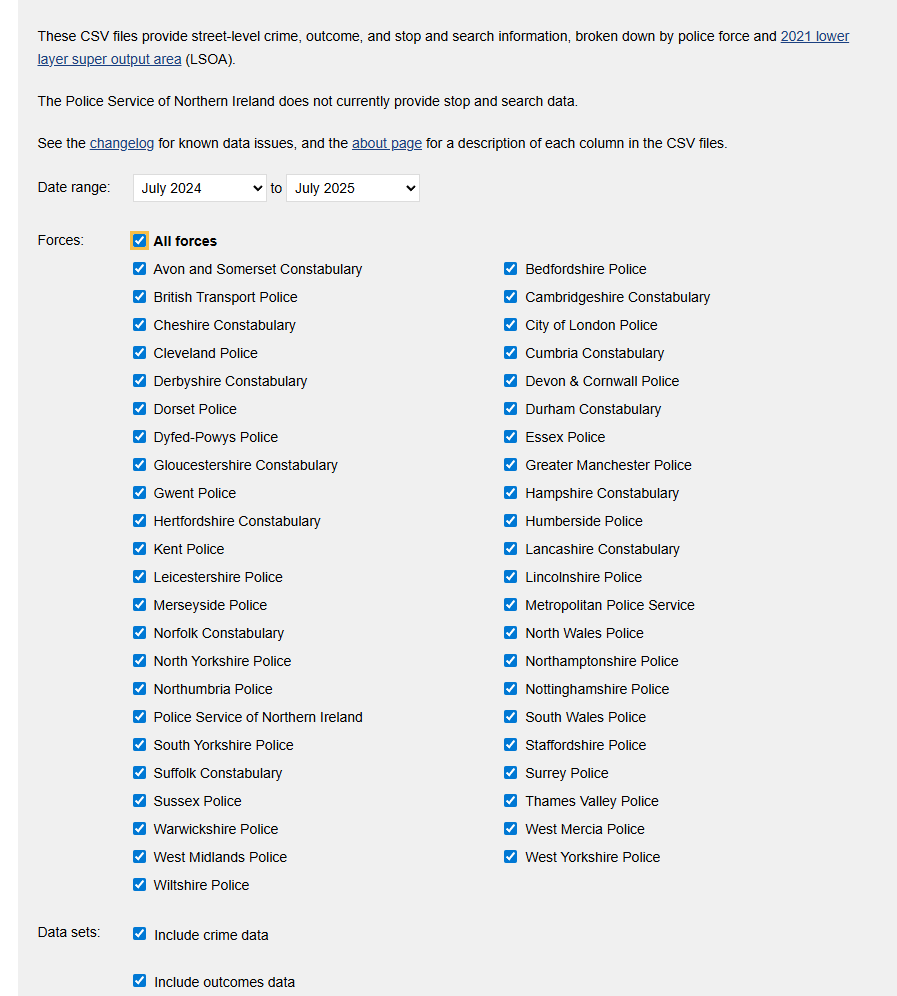
- Data grab: Select the time frame at data.police.uk and download both datasets.
- Build: Create an Alteryx Analytic App with user inputs for date range, crime category, and area (via map polygon or postcode).
- Output: App updates a data source to either Tableau Server, Power BI workspace, or Tableau Public via Google Sheets.
- User flow: User runs app → selects area and timeframe (and category) → dashboard updates accordingly.
- Dashboard: Connect Tableau/Power BI to the refreshed data source and reflect filters.
- Attribution: Before publishing, reference Source: https://data.police.uk/data/
Main Points:
Data filtered July 2024-2025 of crime data and crime outcomes
use that data to build an Alteryx app that can :
1) Allow the user to pick a specific date range
2) Category
3)area (using a map interface tool) or postcode
data used to: update a data source onto our tableau server/your Power BI workspace (or tableau public using google sheets) to feed into a Tableau or Power BI dashboard.
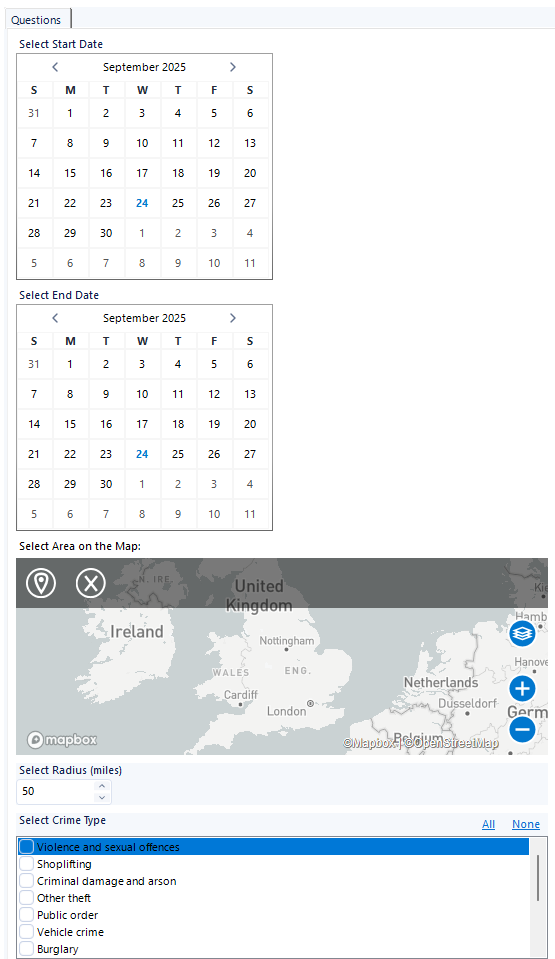
App Main Features:
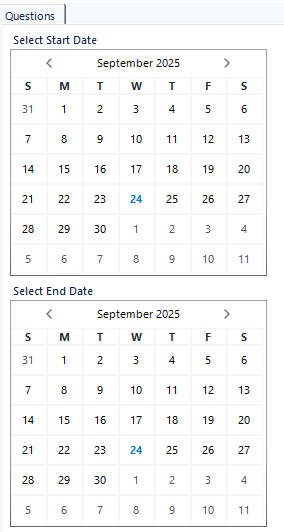
1)Calendar : Select start date and End date
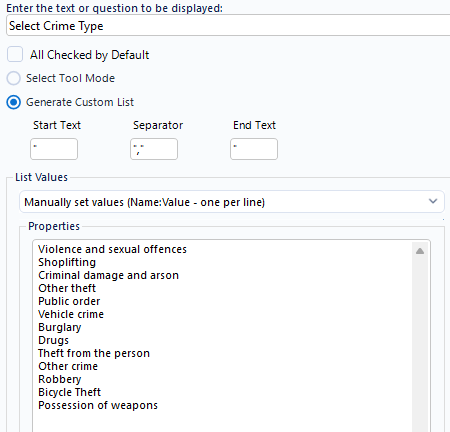
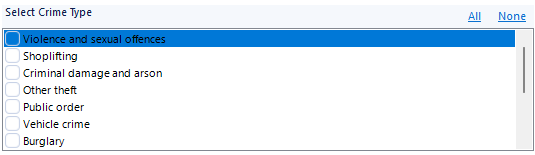
2) List Box: Select Crime Type
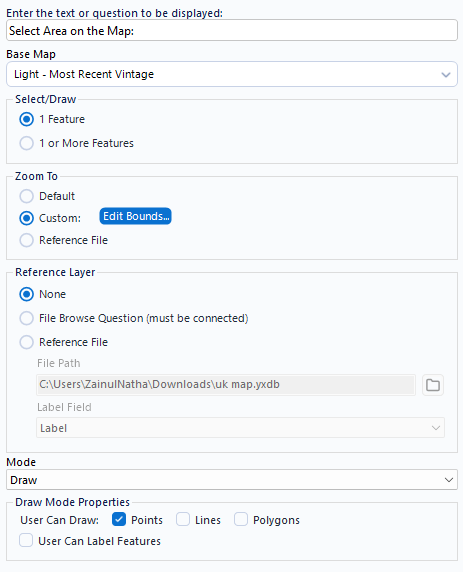
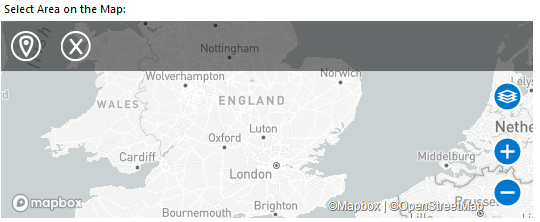
3) Map: Select Area on Map
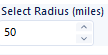
4)Numeric up down: Select Radius Size from Pinned Location
Data Prep Plan:
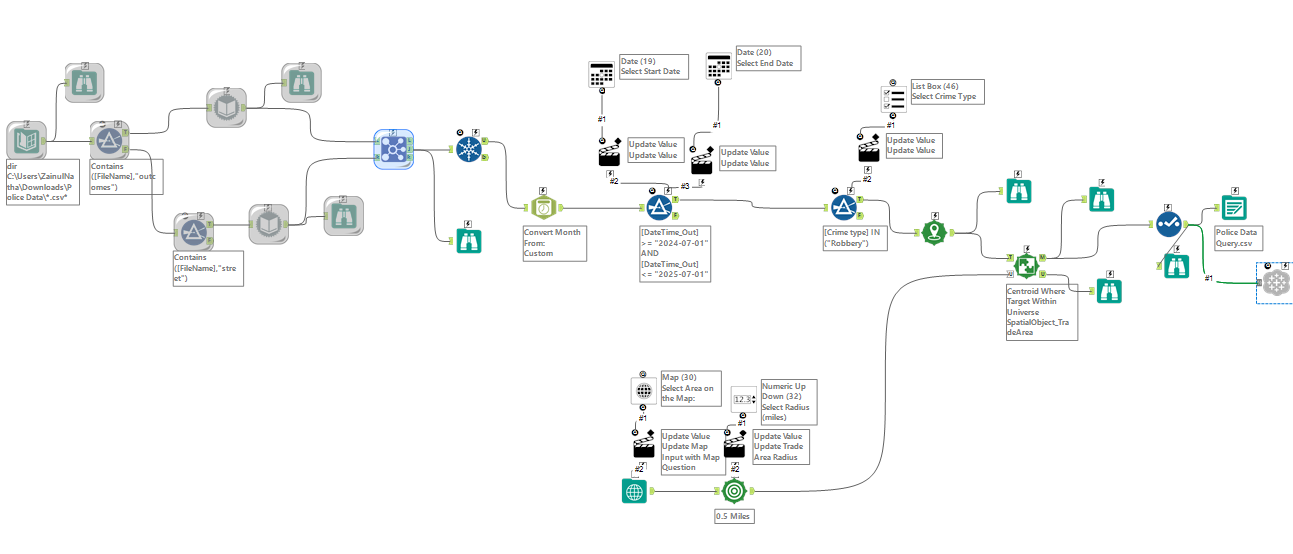
The ZIP contained one folder per month, each with two CSVs: street and outcomes. I used the Directory tool (Include Subdirectories) to list all files, then filtered the list into two streams (street vs outcomes). Each stream was read with Dynamic Input (Auto-configure by Name) so the monthly files were automatically unioned. Finally, I joined the street and outcomes data on Crime ID and ran a Unique tool to remove duplicates.
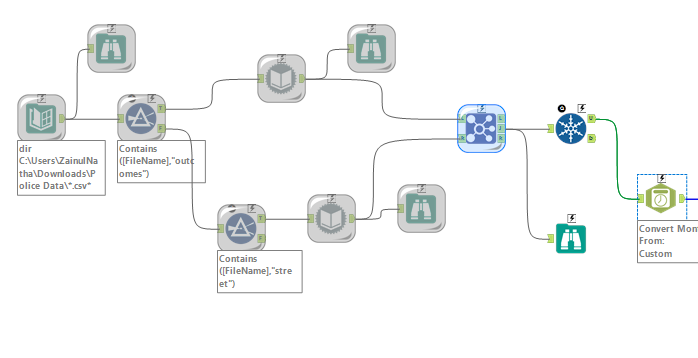
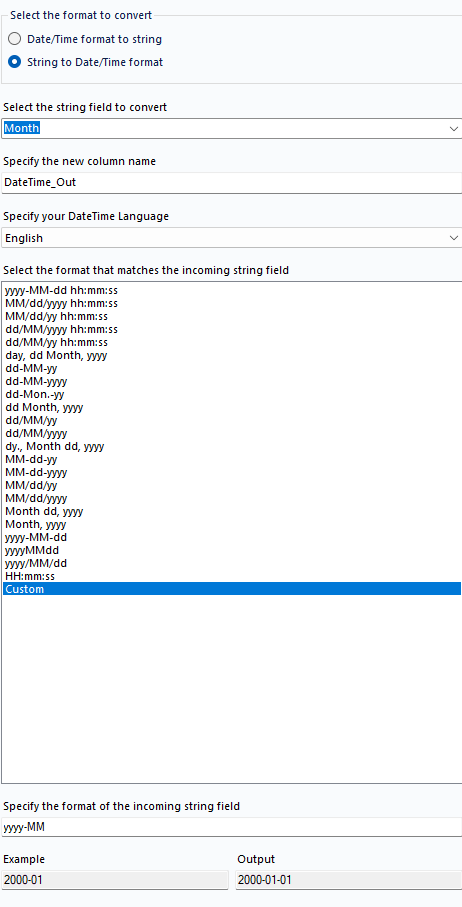
Convert the month field into an appropriate date format using the Date Time Tool.
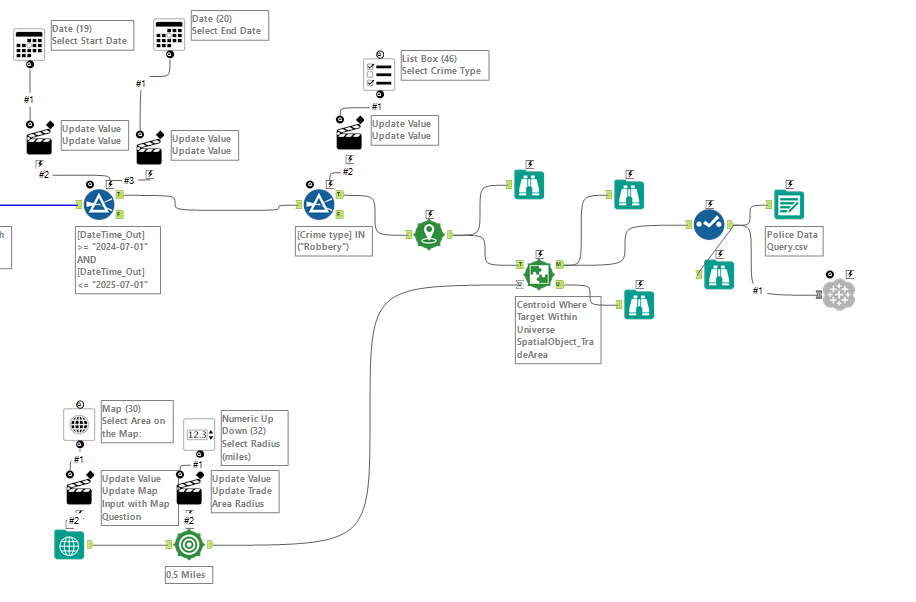
App Workflow:
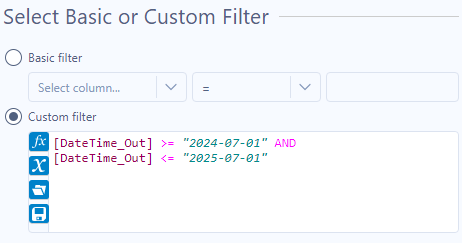
1) Date Selector:
Used a filter tool connected to 2 Date interface tools (One for start date and one for end date) which will update the value.
App Output :
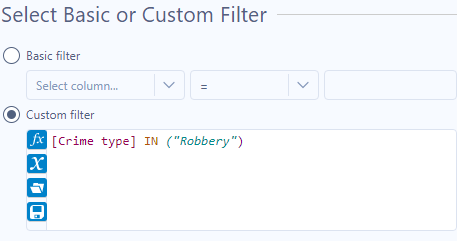
2) Crime Type Selector:
Used a list box tool to connect to a filter that will update value in the app based on selected crime type.
App Output:
3) Select Area on Map:
Used map interface tool which was connected to a map input tool that allows the user to pin specific areas on the map to get crime data.
App Output:
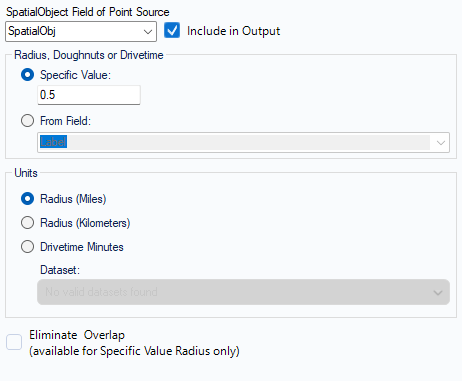
4) Select Radius Size:
Used a trade area tool connected to a Numeric Up/Down interface tool to allow the user to select radius size from the pinned location on the map to give crime data for that area.
5) Tableau Output
Connected to the Tableau Output tool and, since I hadn’t used it before, followed a blog guide to configure authentication and publish my flow’s output to Tableau Server.
Final Workflow
Final App:
Challenges:
- Alteryx Apps & Spatial tools: I’ve only practised Alteryx apps a limited amount, and adding Spatial tools made it harder to design the flow and parameters with confidence.
- Debugging a nil-result area: I pinned a rural location on the map, which returned no crime data. It took a while to realise the point was in the middle of nowhere—once moved to a populated area, results appeared.
- Publishing to Tableau Server: This was new to me. Configuring the Tableau Output tool, generating a personal access token, and creating the data source (name and project) all took longer than planned.
- Time-boxed delivery: With the remaining limited time, I assembled a concise dashboard that surfaces the main insights.
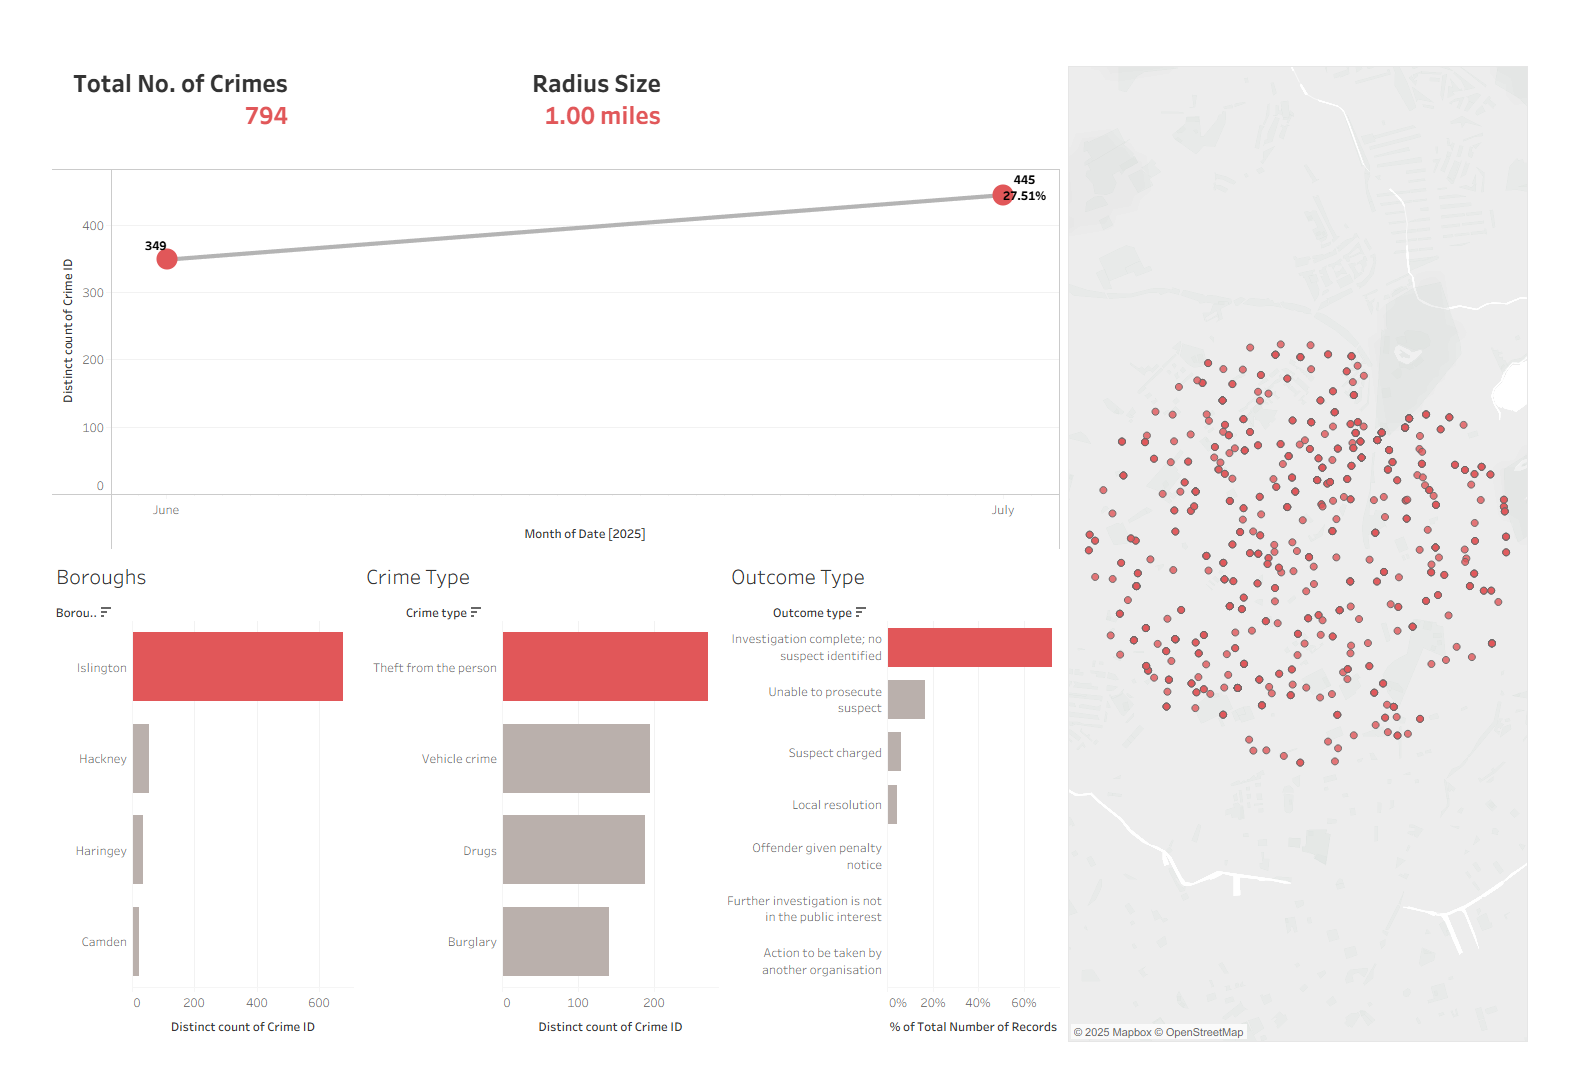
Dashboard sketch:
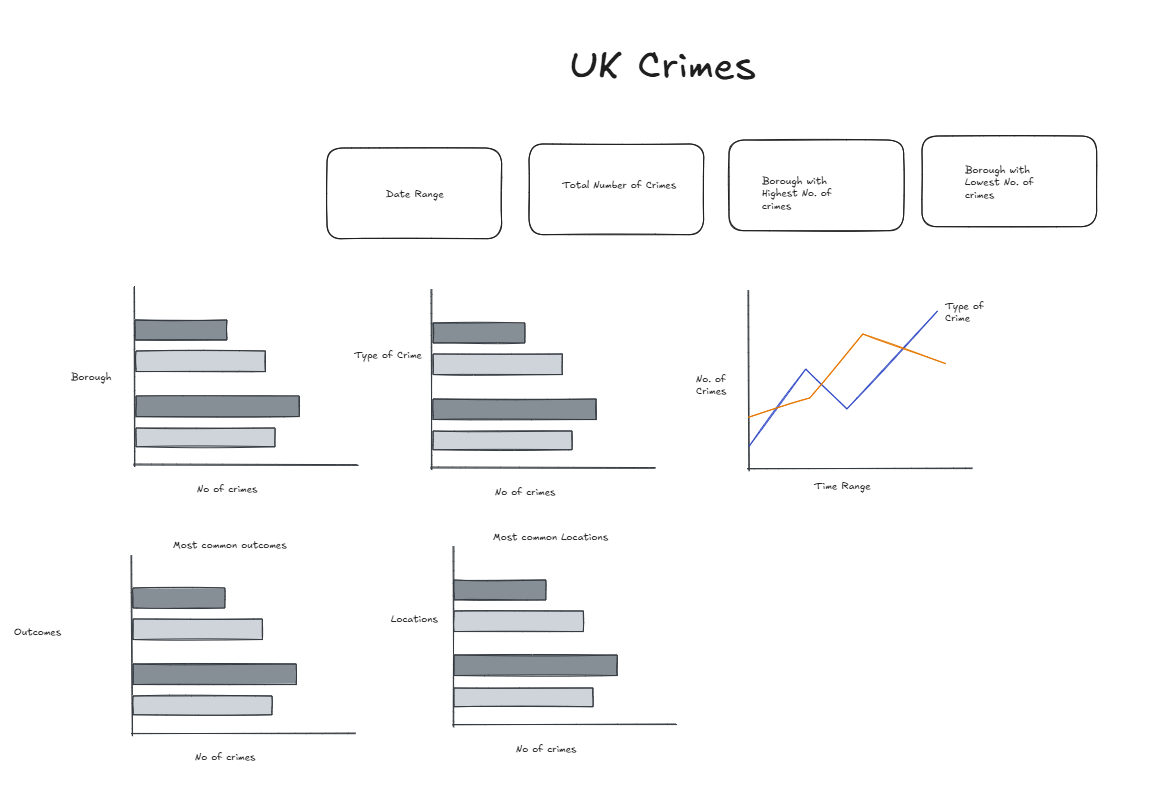
Final Dashboard: