


Brief:
- The challenge: can you find a cool story in this data?
- Tools: Tableau
- Exploration/Cleaning/Reshaping: any tool you like
Data set:
https://www.kaggle.com/datasets/azathoth42/myanimelist?select=AnimeList.csv
Make sure to reference the source & data collectors before publishing as mentioned on Kaggle:
Matěj Račinský, “MyAnimeList Dataset.” Kaggle, 2018, doi: 10.34740/KAGGLE/DSV/45582
Plan:
9:15-10:15pm : Explore data set and identify key fields and any data cleaning that needs to be done
10:30-11:30:Data Cleaning
11:30-12:00 - sketches and get checked
12:00 - 3pm : building the dashboard
Exploring the data :
Cleaned data sets:
cleaned version of the filtered dataset which consists of:
1) files anime_cleaned.csv,
with title, title synonyms, genre, studio, licensor, producer, duration, rating, score, airing date, episodes, source (manga, light novel etc.) and many other important data about individual anime providing sufficient information about trends in time about important aspects of anime. Rank is in float format in csv, but it contains only integer value. This is due to NaN values and their representation in pandas.
2)animelists_cleaned.csv
contains anime lists of all users. Per each record, here is username, anime ID, score, status and timestamp when was this record last updated.
3)users_cleaned.csv.
information about users who watch anime, namely username, registration date (join_date), last online date, birth date, gender, location, and lots of aggregated values from their anime lists.
Issues mentioned in data from author:
This cleaned version has truncated all users with ridiculously large number of episodes in anime which obviously don't have that much episodes, watched episodes larger than number of episodes in individual anime were fixed and seen episodes and watch time were recalculated accordingly.
For some users, last online was 1900 year, just weird values, so their last activity was inferred from their last anime list update timestamp.
Many users incorrectly filled number of rewatched episodes.
For anime where more episodes have been watched than that anime has episodes, watched episodes have been rewritten to number of episodes in that anime. Watch time and number of watched episodes have been fixed accordingly.
Users too young and too old obviously were truncated too.
6 users with most episodes seen, suspiciously lots of episodes, were truncated here too. That is too few users to affect any statistics.
Anime with an ### Context
Potential use cases :
1) see the gender demographics of anime users
2) which anime has been the most popular and least popular over time by users
Data quality issues:
1) Anime cleaned:
Unique ID for each anime title and different details about that specific title
Useful fields
- Anime ID - In both the anime cleaned csv. as well as the Anime List cleaned csv. (can join based on this field)
- Title_english - title of anime (
- Type - Type of Anime (Movie, Music, TV etc.)
- Source
- Episodes - Number of episodes
- airing - true or false whether anime still airing
- rating: age viewing category e.g pg, pg-13 etc
- Score - Score rating between 1-10
- members- number of members for that anime
- premiered - when was that anime first shown broken down by season of year and year e.g Fall 1967 (Can have parameter to search which anime title was most popular by season and by year )
- Studio - which studio anime came from
- Genre - type of genre
- aired from year :gives just the year aired (can split the premiered field where just looks at season column and this column just for year)
2) Users cleaned:
Useful fields
- Username - Data needs some cleaning but can join username field with username on anime lists cleaned. csv
- User ID - can join onto anime lists cleaned csv by username field and add user id to that table
- gender - see the gender split of users
- Location - where the user is from format (City, Country)
- Birth date - birthdate of user format (date:10/01/1969 00:00:00) change to date and then can work out age demographic of each user
3) Anime list cleaned:
Useful fields
- anime_id - can link to anime table (need to add to users table to be able to join between anime titles and users)
- my score - score of each individual user of a specific anime id
Final User Story:
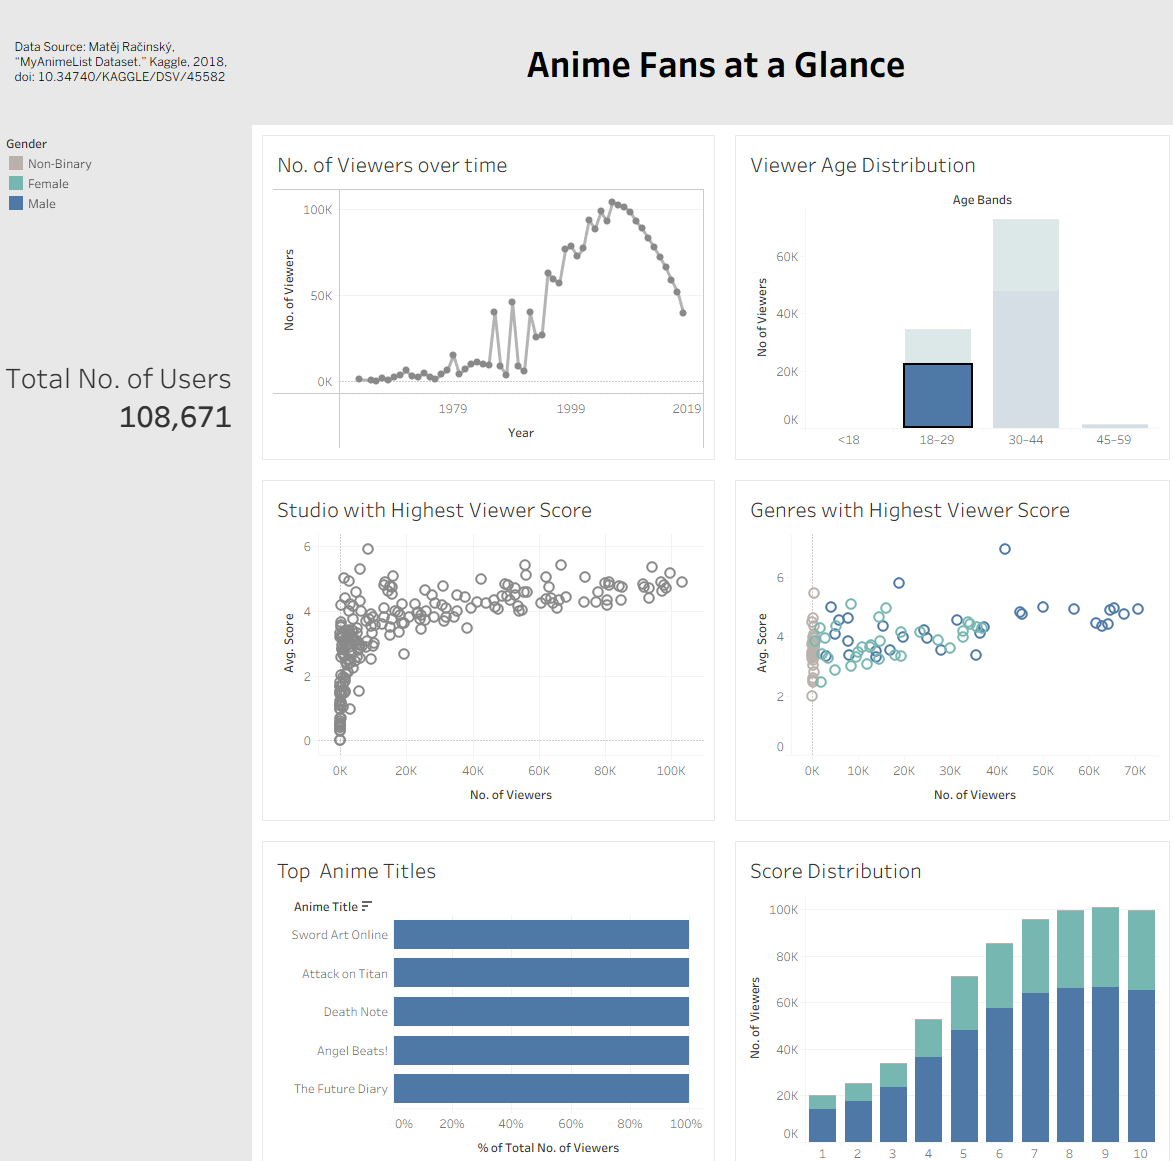
As an upcoming TV-anime studio, I want to understand who our viewers are, what’s most popular, and how we compare to other studios so I can tailor content and spot market opportunities.
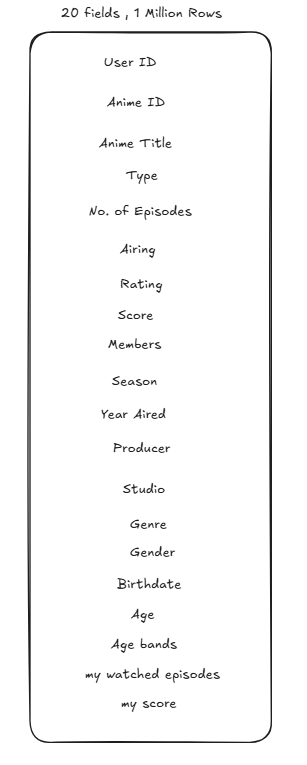
Data table needed:
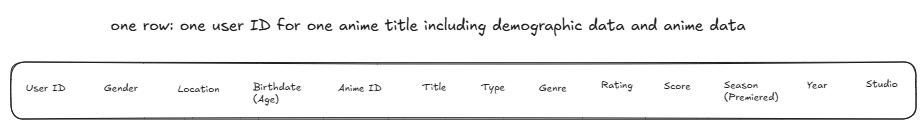
Data cleaning:
After data cleaning I altered my table to the following fields as location was too time consuming to clean and add
Sketch idea of charts to include:

Final Dashboard:
After testing several visuals, I switched to a scatter plot to better show the relationship between number of viewers and average score, which makes studio performance easier to compare. I also made the charts filterable so you can drill down to see which titles have the highest views and explore the score distribution to understand how individual titles were rated by viewers.
Challenges:
- Data volume & domain gap: The dataset had many fields in a domain I didn’t know well, so extra time went into spotting useful fields and the correct join keys across CSVs.
- User story iteration: The first, generic story lacked specificity; I reworked it several times to make it concrete and actionable.
- KPI & formatting slipped: With limited time, KPI tiles and formatting weren’t finished. Planned KPIs: highest-average-score studio, top genre by viewers, and most/least-viewed titles (all time).
- Filter order bug (Tableau): The “Top Anime Titles” bar wouldn’t respond to scatter selections due to order of operations. Adding the filter to Context fixed it, but it consumed time reserved for KPIs/formatting.