


Brief:
Data set:
https://api.nasa.gov/index.html?search=#main-content
Today’s challenge for DS52 is to pick one (or multiple) API’s of your choice to pull your data from and use to build a Tableau, Power BI workbook or Alteryx App that outputs interactive charts and reports.
Everyone should pick a different API, exceptions are allowed if your projects are focusing on different aspects of the API but this has to be approved by myself. Astronomy Picture of the day API is not allowed as they’ve built on this during training.
That’s it, no other rules apart from the usual Dashboard Week rules we outlined on day 1.
Plan:
1)Pick API want to pull data from
2)use previous API workflow as a template on how to pull the data (by 10:30am)
3)Do any Data Cleaning if needed
4) decide the key fields and what interesting insights i can get
5)Sketch charts and dashboard layout (by 12:00pm)
6)Build a Dashboard in Tableau (after lunch)
1)Picking the API:
Picked Mars Rover Photos as the API
About the API:
a)Purpose: This API is designed to collect image data gathered by NASA's Curiosity, Opportunity, and Spirit rovers on Mars and make it more easily available to other developers, educators, and citizen scientists. This API is maintained by Chris Cerami.
Each rover has its own set of photos stored in the database, which can be queried separately. There are several possible queries that can be made against the API.
b)How photos are organised?
Photos are organised by the sol (Martian rotation or day) on which they were taken, counting up from the rover's landing date. A photo taken on Curiosity's 1000th Martian sol exploring Mars, for example, will have a sol attribute of 1000. If instead you prefer to search by the Earth date on which a photo was taken, you can do that, too.
Note- can decide to do either earth dates or rovers landing date
c) Can filter by camera type
Results can also be filtered by the camera with which it was taken and responses will be limited to 25 photos per call.
Queries that should return more than 25 photos will be split onto several pages, which can be accessed by adding a 'page' param to the query.
Specific API info from:
 corincerami
decided to query and recieve data on latest photos for a specific rover
Query For Latest Photos
If you just want to receive photo data for the most recent Sol for which photos exist for a particular rover, you can visit the /latest_photos endpoint.
Data Prep in Alteryx:
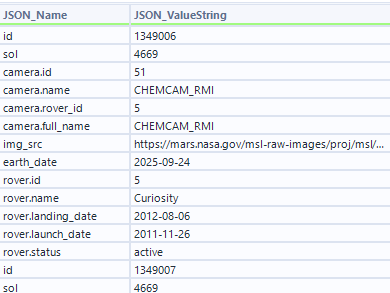
downloaded data looks as such :
[{"id":1349006,
"sol":4669,
"camera":{"id":51,"name":"CHEMCAM_RMI"
"rover_id":5,
"full_name":"CHEMCAM_RMI"},
Alteryx Workflow:
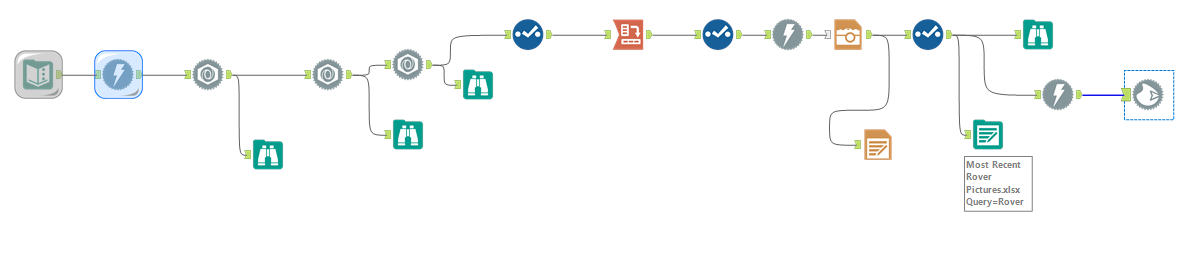
The workflow required me to parse the data from the API using the JSON Parse tool
I used a Crosstab tool to reshape the fields the way I needed. The issue came when rendering image URLs in Tableau—only some would display. I fixed this by updating the Alteryx flow: added a Download tool to fetch each URL as a blob, then a Blob Output tool to write the blobs to PNG files, which Tableau rendered reliably.
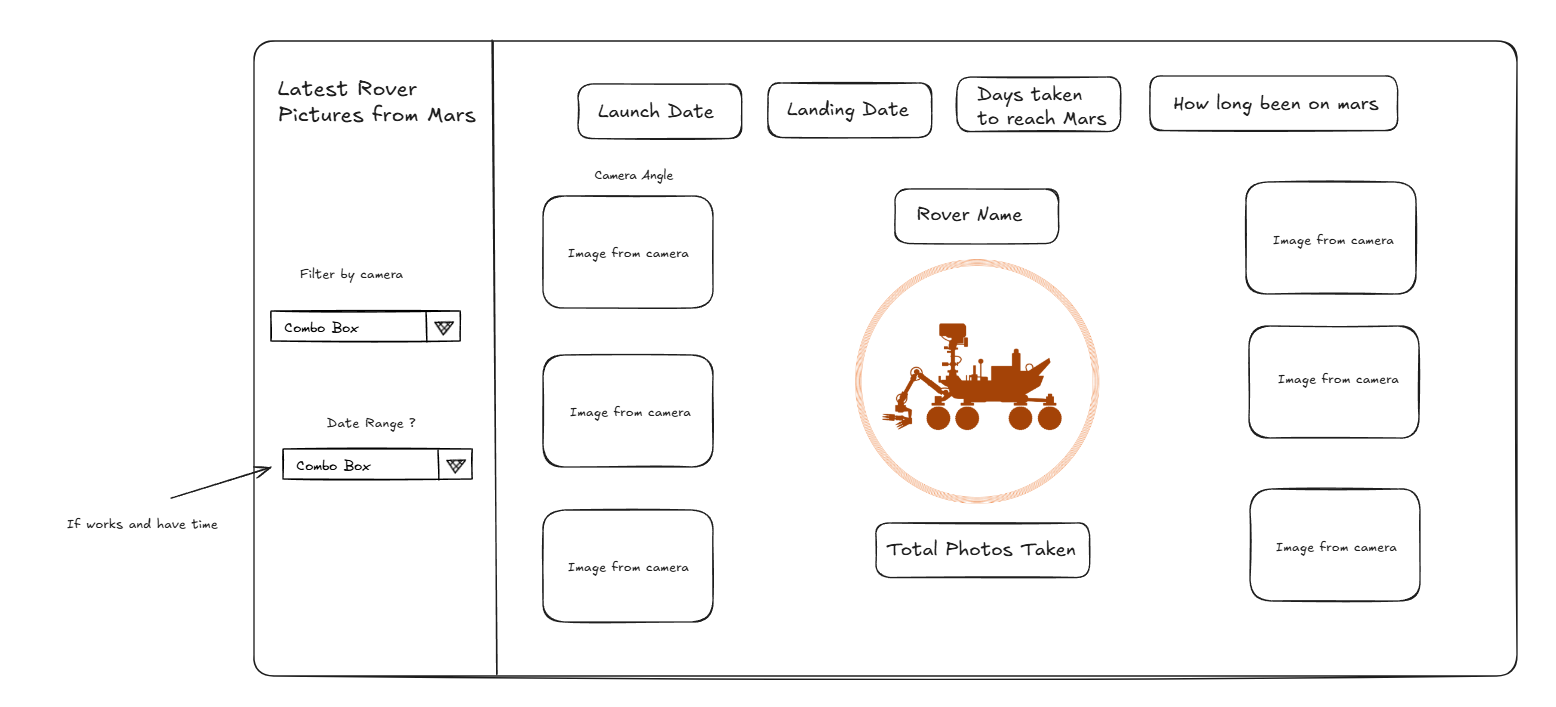
Sketch:
Adding URL images to my tableau dashboard:

I spent a long time trying to render images in Tableau directly from the URLs. Even after setting the field to Image URL, only a few would display. The fix was to update my Alteryx workflow: I added a Download tool to fetch each URL as a binary (blob) and then used Blob Output to write the files (e.g., .jpg/.png). Pointing Tableau to these local images made them render consistently
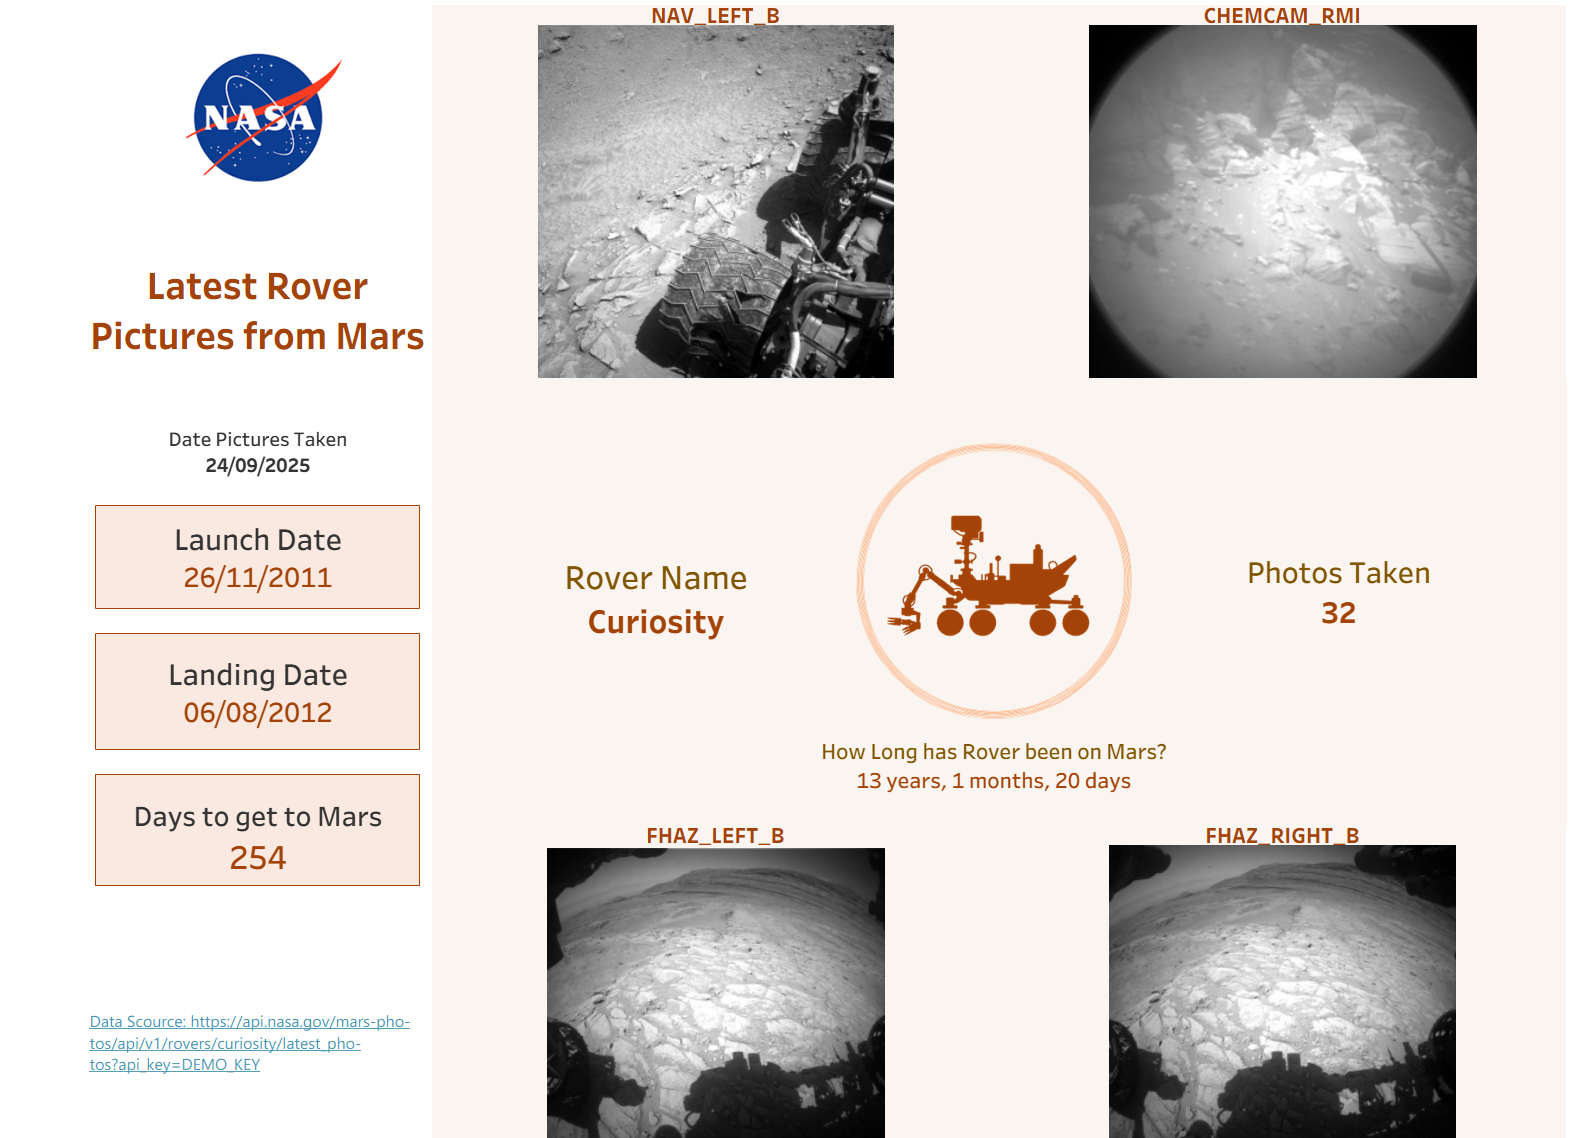
Final Dashboard:
Next steps:
With more time, I’d expand the dataset to include multiple rovers and wider date ranges, add a toggle parameter so users can cycle through multiple images per camera angle, and integrate a Mars weather API to show temperature, pressure, wind, and dust for each photo’s date and location so viewers see both the image and the conditions on Mars at that moment.