


Learn how to use Tableau’s spatial functions like MAKEPOINT and MAKELINE to plot dynamic flight routes from a selected origin airport to multiple destinations on a map.
Introduction
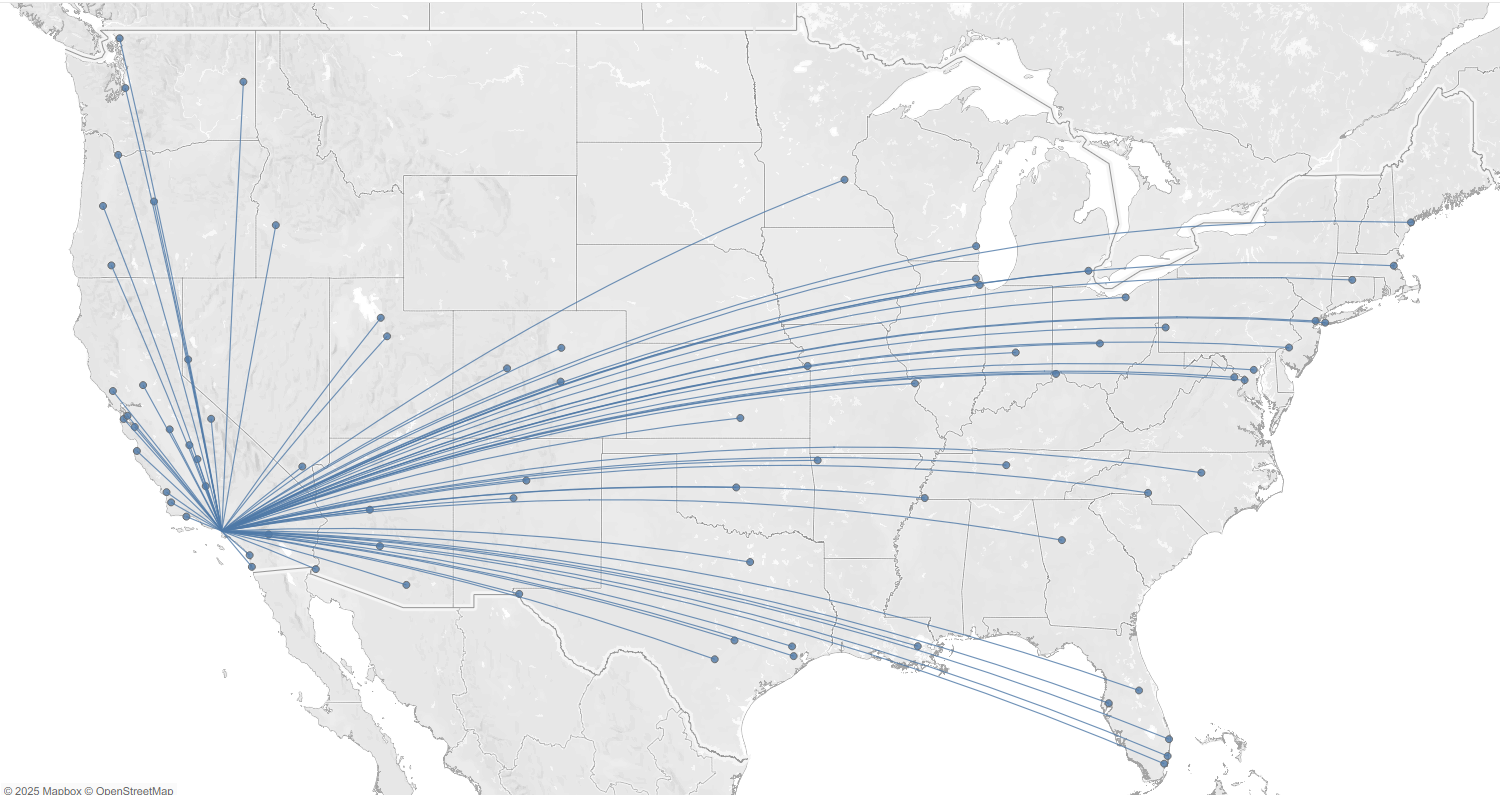
Spatial analysis is a powerful feature in Tableau, allowing you to go beyond simple points on a map and start answering real-world geographical questions. One common use case is in the airline or logistics industries, where analysts need to visualize routes between two or more locations.
In this tutorial, we’ll walk through how to use Tableau’s spatial functions — specifically MAKEPOINT and MAKELINE — to plot flight paths from one origin airport to multiple destinations. This approach can be used for customer travel analysis, shipment routes, or any scenario where you’re connecting two locations on a map.
What You’ll Learn
- How to use
MAKEPOINTto generate spatial locations from latitude and longitude - How to use
MAKELINEto draw lines between origin and destination points - How to visualize these spatial lines on a map in Tableau
- How to calculate the distance for each flight path
Step 1: Prepare Your Data
You’ll need a dataset with at least the following columns:
-Origin Airport
-Origin Longitude/Latitude
-Destination City/ Airport
-Destination Longitude / Latitude
Step 2: Create Spatial Calculations
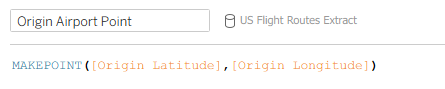
1. Create Origin and Destination Points
In Tableau, create two calculated fields:
Origin Point:
Destination Point:
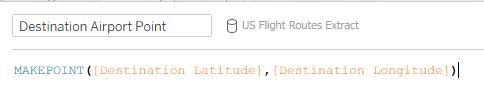
MAKEPOINT creates a geographic point from latitude and longitude, allowing Tableau to recognize it as a mappable location.
2. Create the Route Line
Now create a line between the two points:
Flight Path Line:
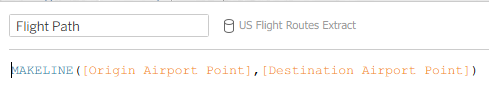
MAKELINE connects two points to create a spatial line object, perfect for visualizing routes.
Step 3: Build the Map
- Drag the
Flight Path Linefield onto Rows - Change the mark type to Line
- Add dimensions like Origin Airport and Destination Airport to Detail
- Customize tooltips to show relevant route info
- Filter specific Airport to show flight paths from that specific airport
Bonus: Add distance for each flight path
Create a new calculated field called Flight Distance:
DISTANCE([Origin Point], [Destination Point], 'km')
- The third argument (
'mi') specifies the unit of measurement. Options include:'km'→ kilometers'mi'→ miles'm'→ meters'ft'→ feet
Use the Distance in Your View
- Drag Flight Distance to Tooltip so users can see how far each route travels.
Conclusion
With just a few spatial calculations, you can transform flat flight data into a dynamic, interactive map showing routes between airports. Tableau’s spatial functions like MAKEPOINT and MAKELINE make this easier than ever — and they open the door to more complex geospatial storytelling.
Whether you're tracking shipments, plotting store-to-customer deliveries, or analysing airline coverage, this approach gives your dashboards a compelling, geographical dimension.