


In today’s data-driven world, location matters. Whether you’re planning retail expansion, optimising delivery routes, or analysing customer demographics, spatial analytics helps answer critical business questions. With Alteryx’s spatial tools, you can easily combine customer and store location data to gain actionable insights.
In this blog, we’ll:
- Introduce key spatial tools in Alteryx.
- Walk through a use case: finding the best new shop location in Brussels based on proximity to current customers.
Part 1: Introduction to Key Spatial Tools
Before diving into the case study, let’s briefly look at the Alteryx spatial tools we’ll be using.
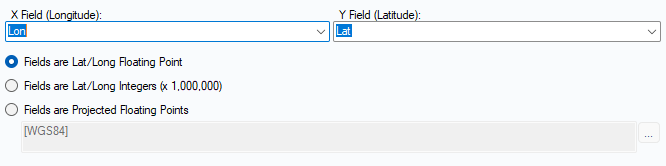
1. Create Points

- Converts latitude/longitude or address coordinates into spatial points.
- Input: numeric lat/long fields.
- Output: geometry object that can be visualized and used in spatial calculations.
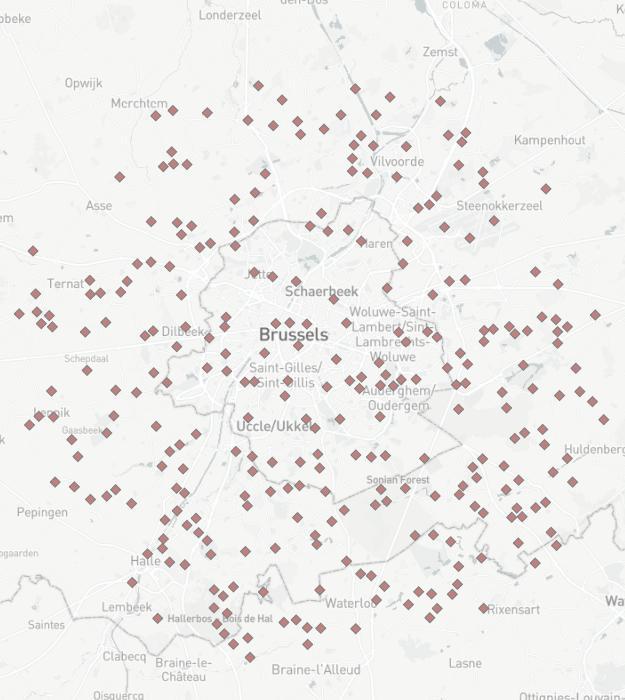
👉 Example: Convert your customers’ addresses into spatial points on a Brussels map.
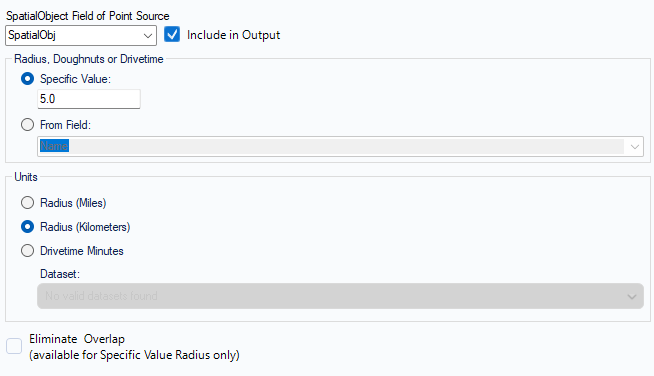
2. Trade Area

- Creates a circular buffer around a point.
- Input: a point (e.g., shop location) + distance value (e.g., 5 km).
- Output: a polygon showing the catchment area.
👉 Example: Build a 5 km radius trade area around each shop location.
3. Spatial Match

- Compares two spatial objects and matches them if they intersect.
- Input: Target (e.g., customers) and Universe (e.g., shop trade areas).
- Output: Matched records with details of which customer falls within which shop area.
👉 Example: Match Brussels customers to the shops whose trade areas they fall into.
4. Distance

- Calculates the straight-line distance between two spatial objects.
- Input: Two point layers (e.g., customers and shops).
- Output: Numeric field with distance.
👉 Example: Measure how far each customer is from their nearest shop.
Part 2: Use Case – Brussels Shop Location Analysis
Let’s apply these tools to a practical retail scenario.
Business Question
- We have current customers based in Brussels.
- We are considering new shop locations.
- We want to:
- Find the shop location that has the most customers within 5 km.
- Calculate the average distance from customers to the shops within that 5 km range.
Step 1: Prepare the Data
- Import customer data with lat/long.
- Import candidate shop locations with lat/long.
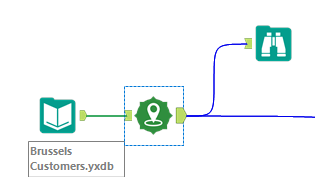
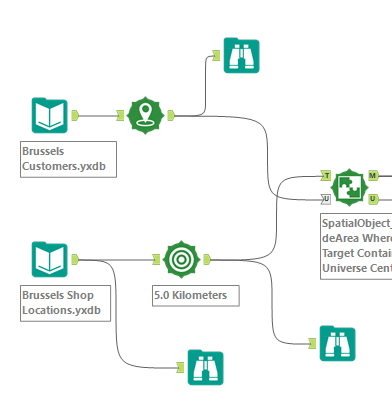
Step 2: Visualise Customer Locations from the Data
- Add Create Point tool add long/lat to X and Y field
- Use Browse too to see the locations of Customers
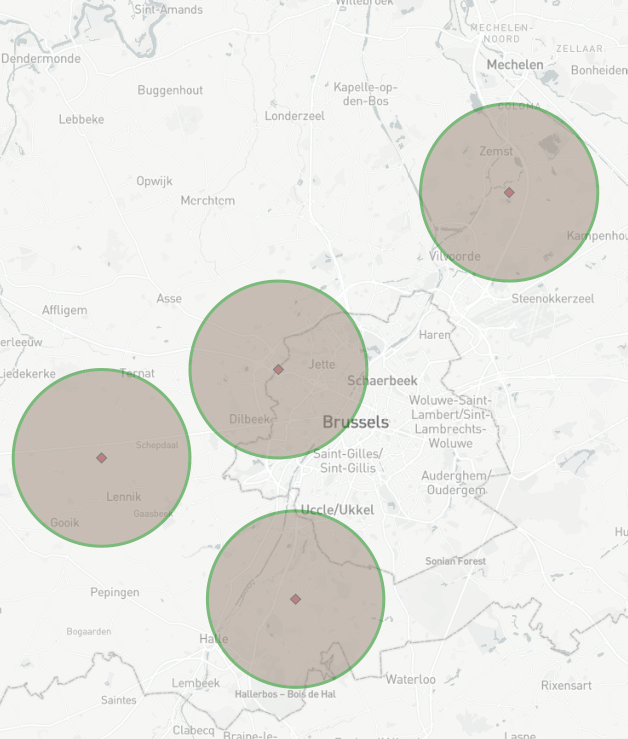
Step 3: Add 5km buffer to shop locations
- Add Trade Area tool to Shop Locations Input
- Specify Radius distance (5.0) and units in Km.
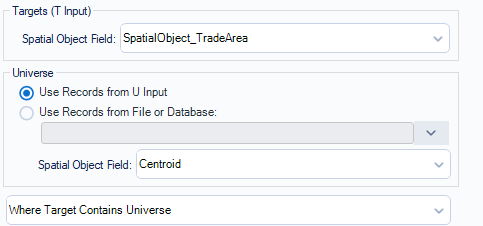
Step 4: Join the Customer and shop location data
- Use Spatial Match tool to join the Customer and shop location data
- Join the Shop Locations to the Target and the Customer Locations to the the Universe inputs
- As we only want to see customers that are within the 5.0Km radius we click the dropdown "Where Target contains Universe".
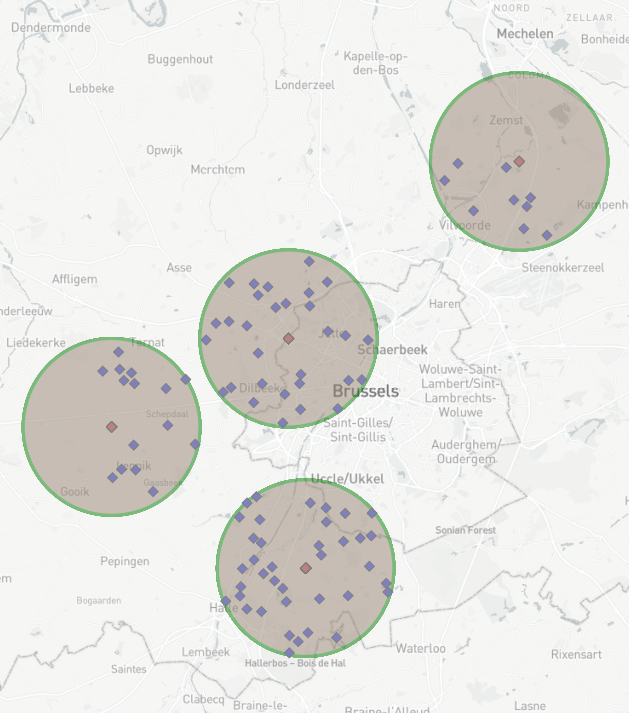
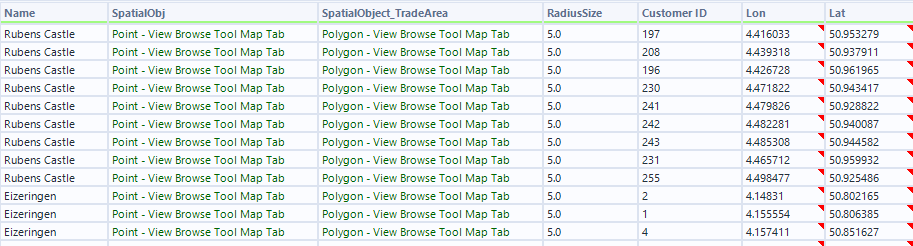
- Match Output will show only customers that are within the 5.0km of the shop location.
Step 5: Calculate the Average distance between Customers and each store
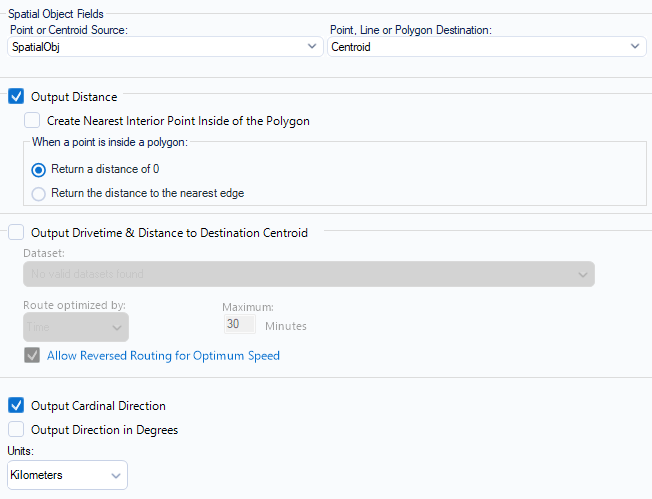
- Use Distance tool to calculate the distance between each customer and shop location
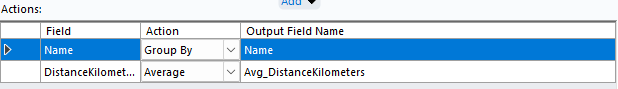
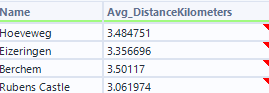
- Add a summarise tool to group by each shop location and aggregate the distance to work out the average for each store location.
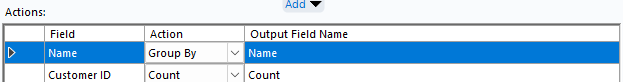
Step 6: Calculate the No. of Customers within 5Km of the store location
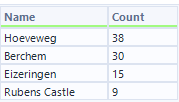
- Use a summarise tool to group by store name and then count count customer ID to see the number of customers that are within 5km distance of the store.
- Use a sort tool to sort in descending order to see which store has the highest number of customers within 5km radius.
Conclusion
By combining Create Points, Trade Area, Spatial Match, and Distance, we transformed raw customer and shop coordinates into powerful business insights:
- We identified the optimal shop location (most customers nearby)
- We measured average customer distances, helping us evaluate convenience and accessibility.
This approach is not just for retail — the same workflow applies to logistics, healthcare, marketing campaigns, and public services.
Spatial analysis in Alteryx makes location-based decision-making both simple and scalable.